Sometimes teaching turns out to be very different from the usual lecture on a Wednesday. I was asked (well I signed up) to teach in the Kinderuni (children’s university) at my home institution, the University of Bern. This was part of program where children between the ages of 8-12 are invited to participate in a lecture (Friday) and then in a seminar (Saturday). In what follows I will mainly talk about the lecture.
Anchoring
I talked about decision making and experiments as a methodological approach. My aim was to have many examples and run experiments with them in class. 75 children showed up on Friday for the lecture. Having a mobile makes running in-class experiments really easy - but I could not rely on that - hence back to paper and pencil. We started off with an anchoring task, the classic: multiply the following numbers 1*2*3*4*5*6*7*8*9 for one group and the reverse for the second seemed a little to hard for 8-years old so I used addition instead 1+2+3+4+5+6+7+8+9. This worked reasonably well (a brave helper typed in the numbers, while I worked through another example with them) and we could demonstrate quite a substantial anchoring effect (400 v 1400) which was explained back to me, by one of the kids in great detail - pretty cool.
Wisdom of the crowds
As mentioned above, while a lot of typing was going on I let them estimate three quantities: I had 1) a big glass vase with ping pong balls. 2) a picture of many Legos and 3) I let them estimate my weight.
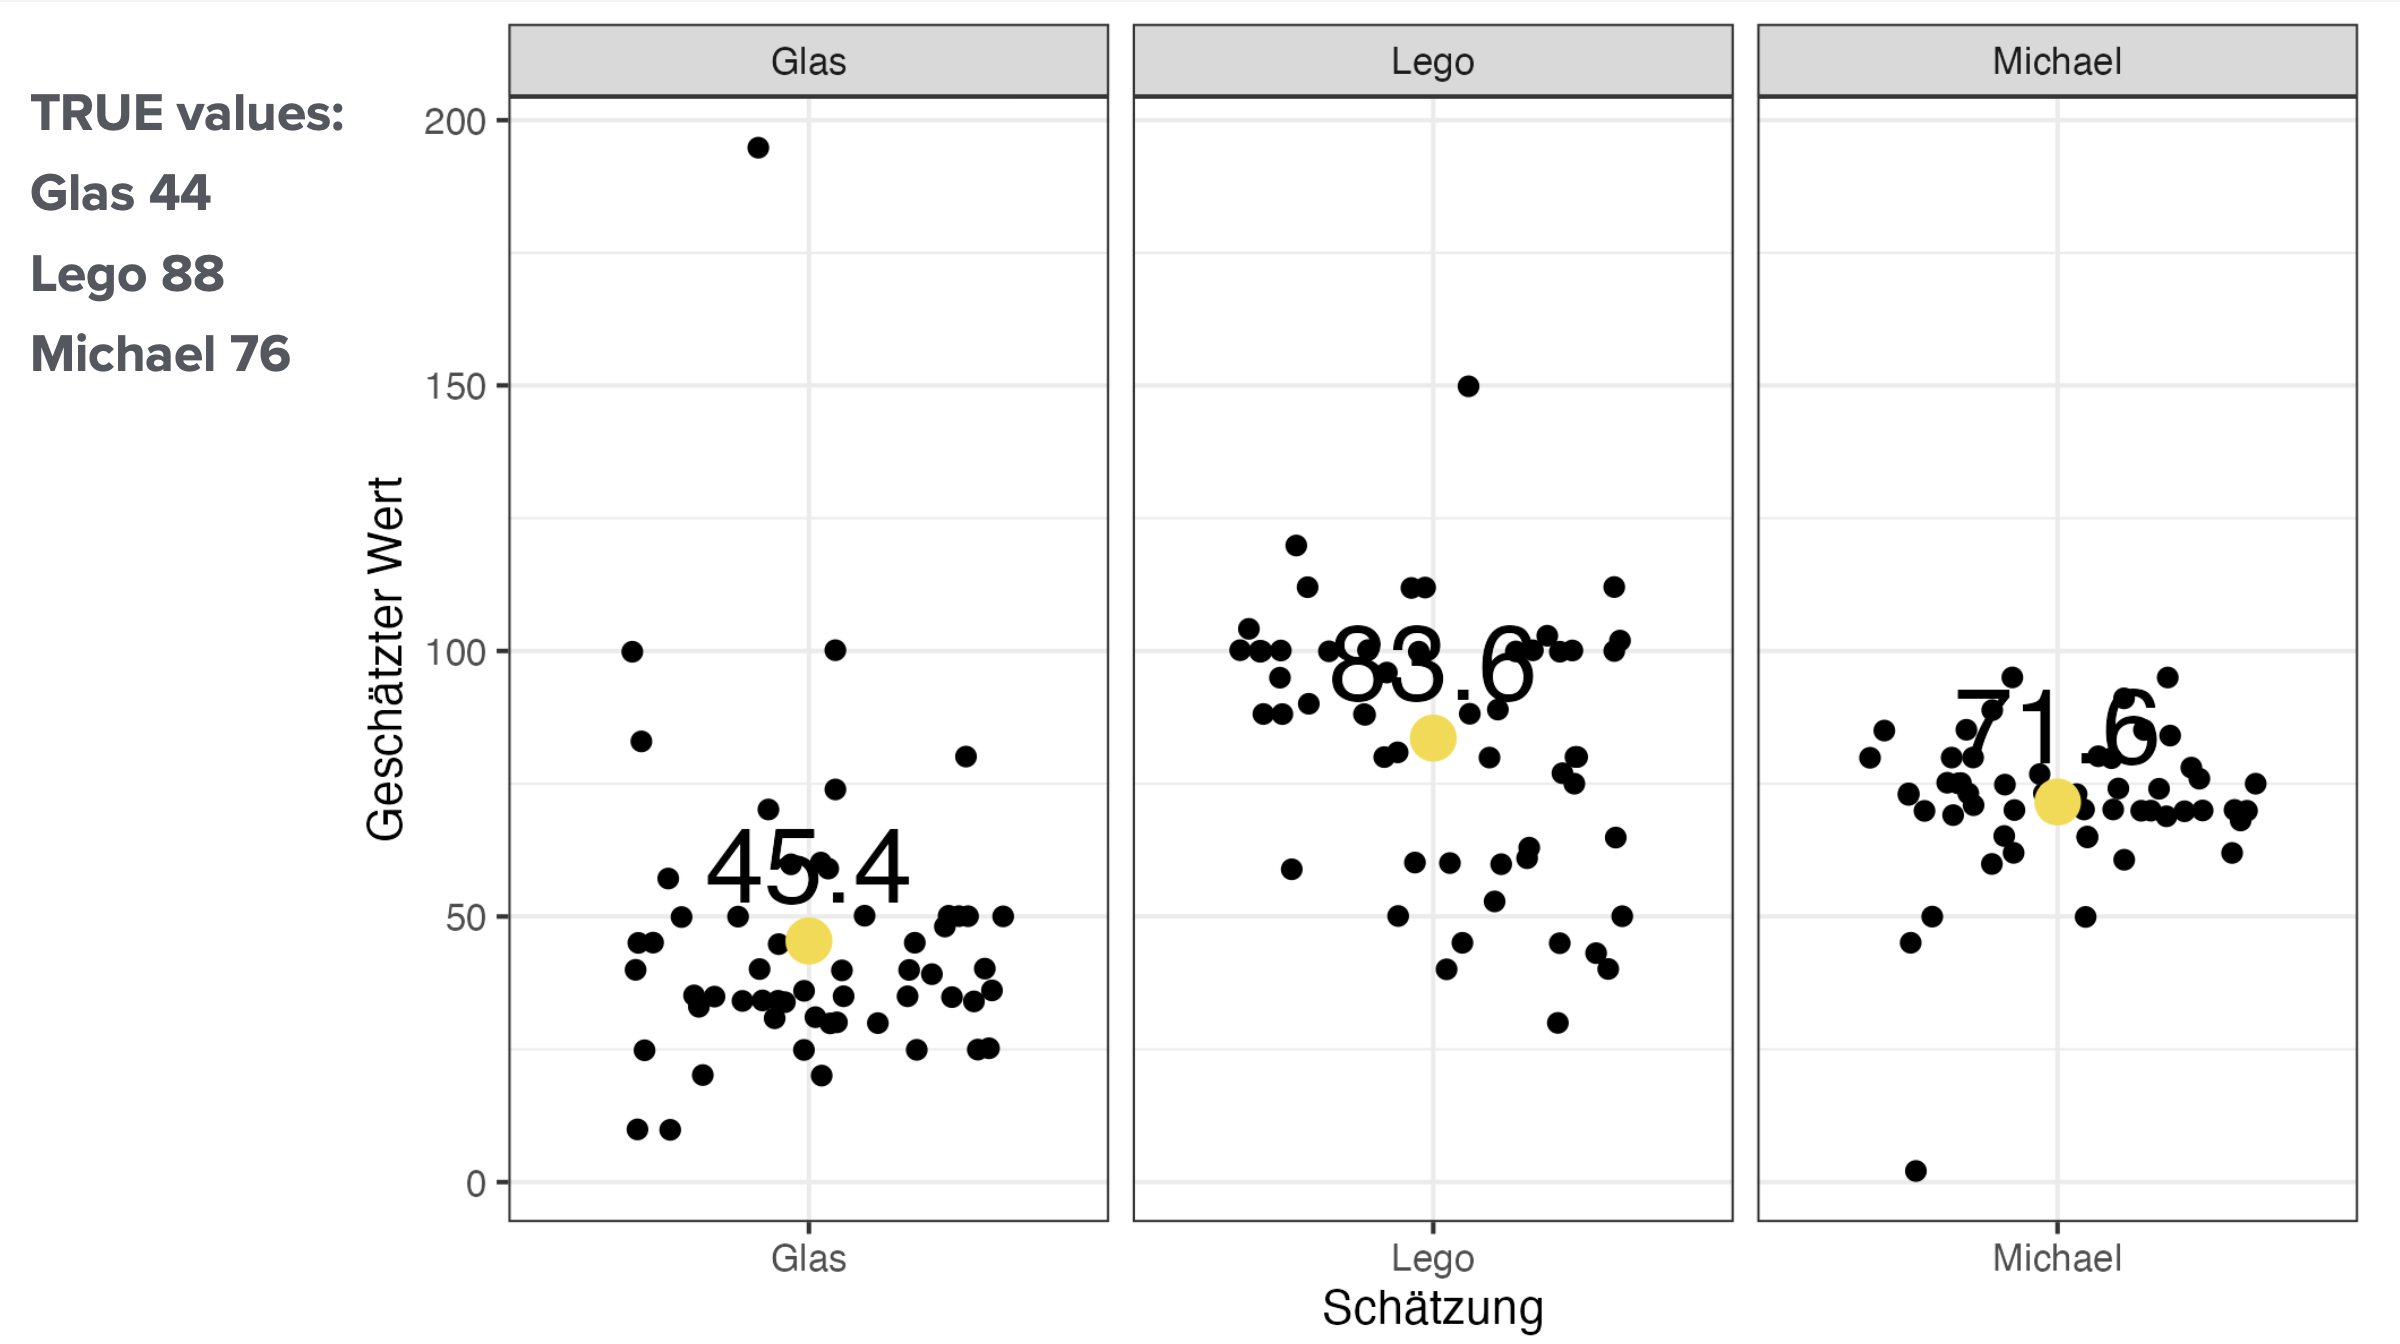
There were 44 balls, 88 Legos and my own weight (on the morning of the lecture) 76 kg. The average of the whole group was off by 1 ball (pretty good!), 4 Legos and 5 kg (I just look too slim I guess) - we talked a bit about individual choices and the averages - again tricky for the little ones, pretty ok for the older.
Risk
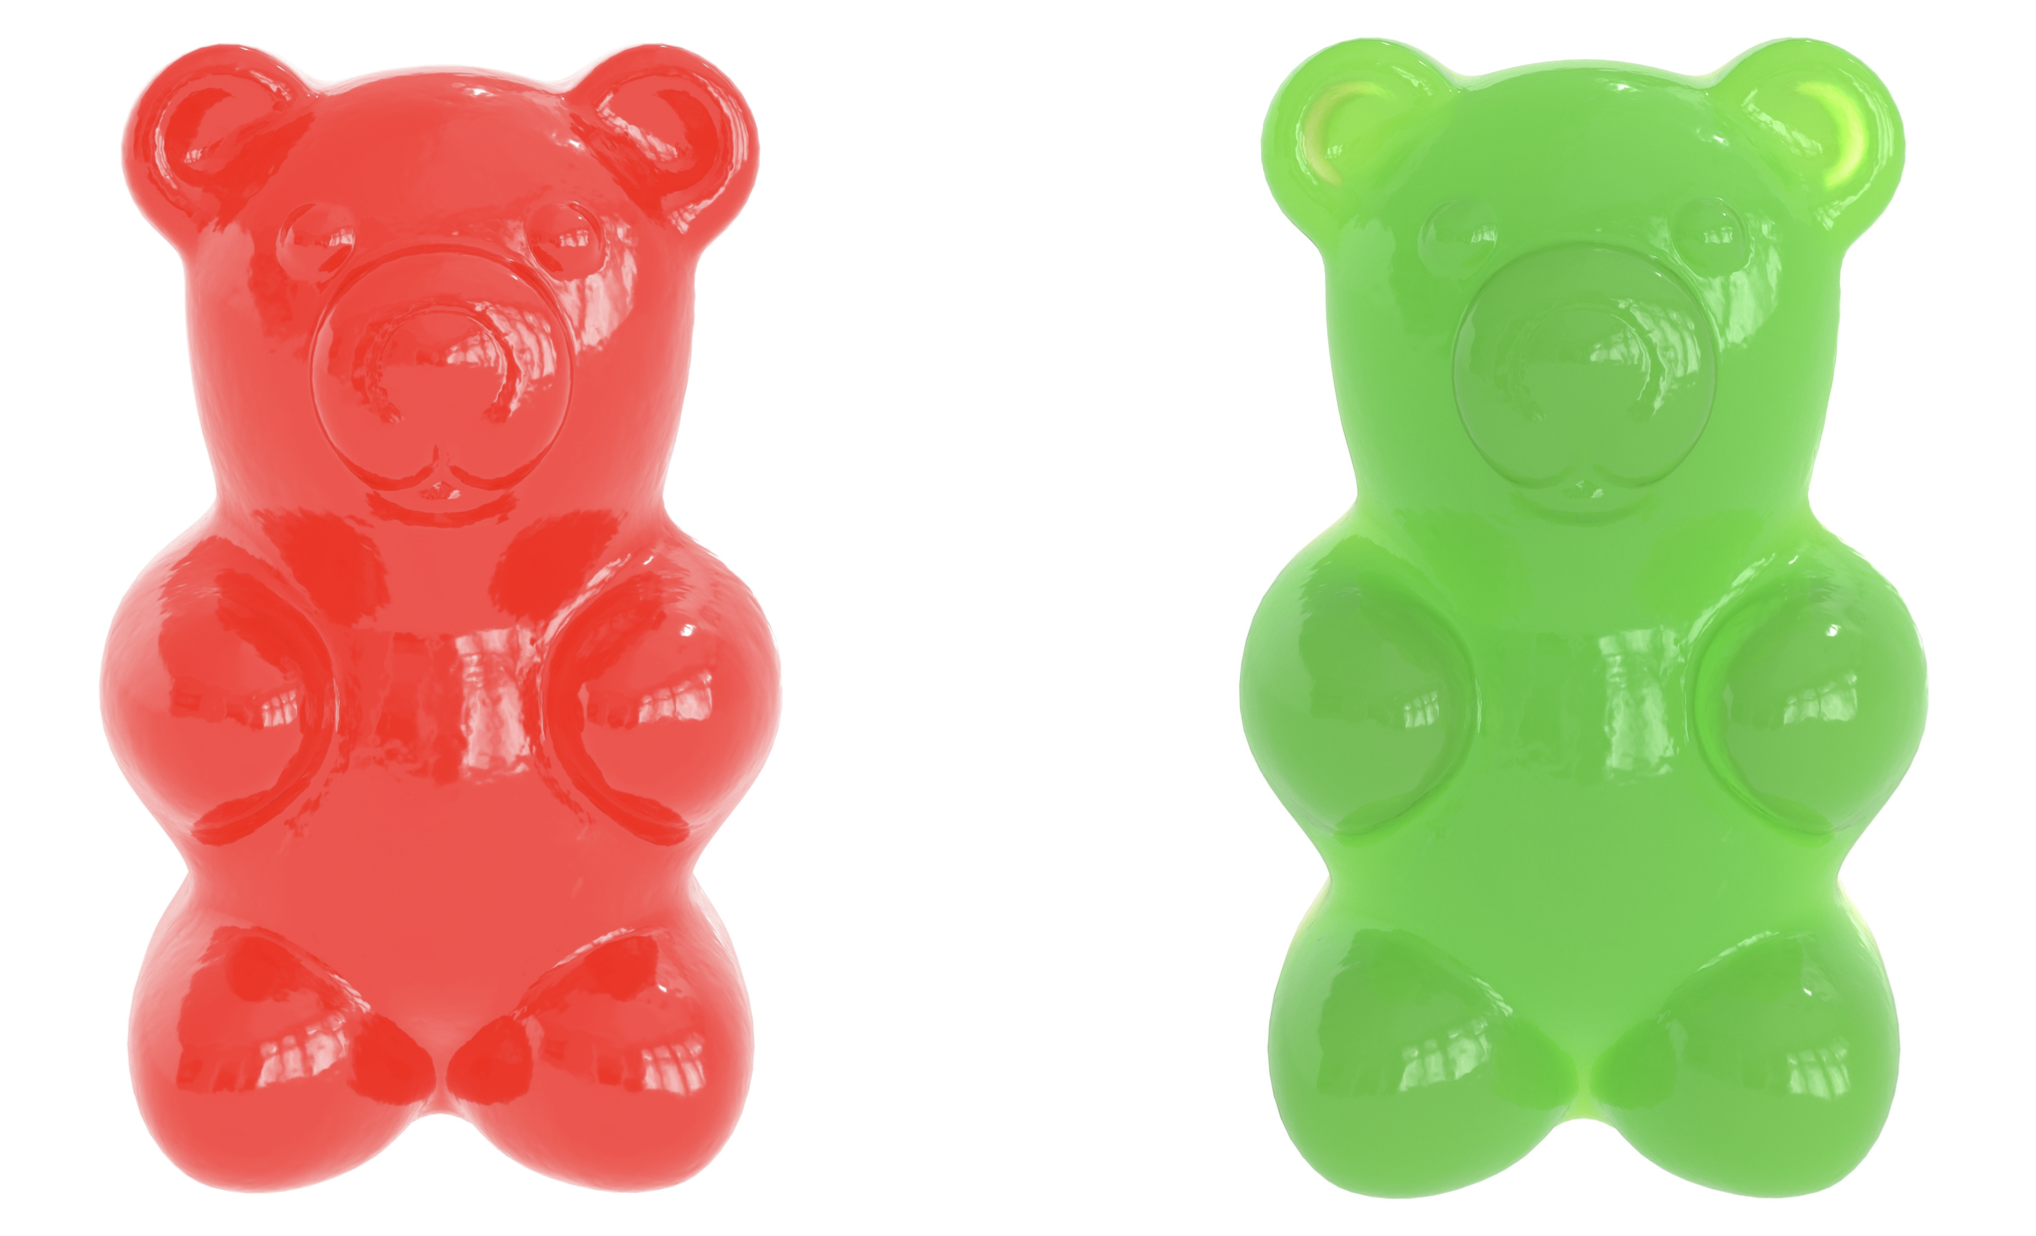
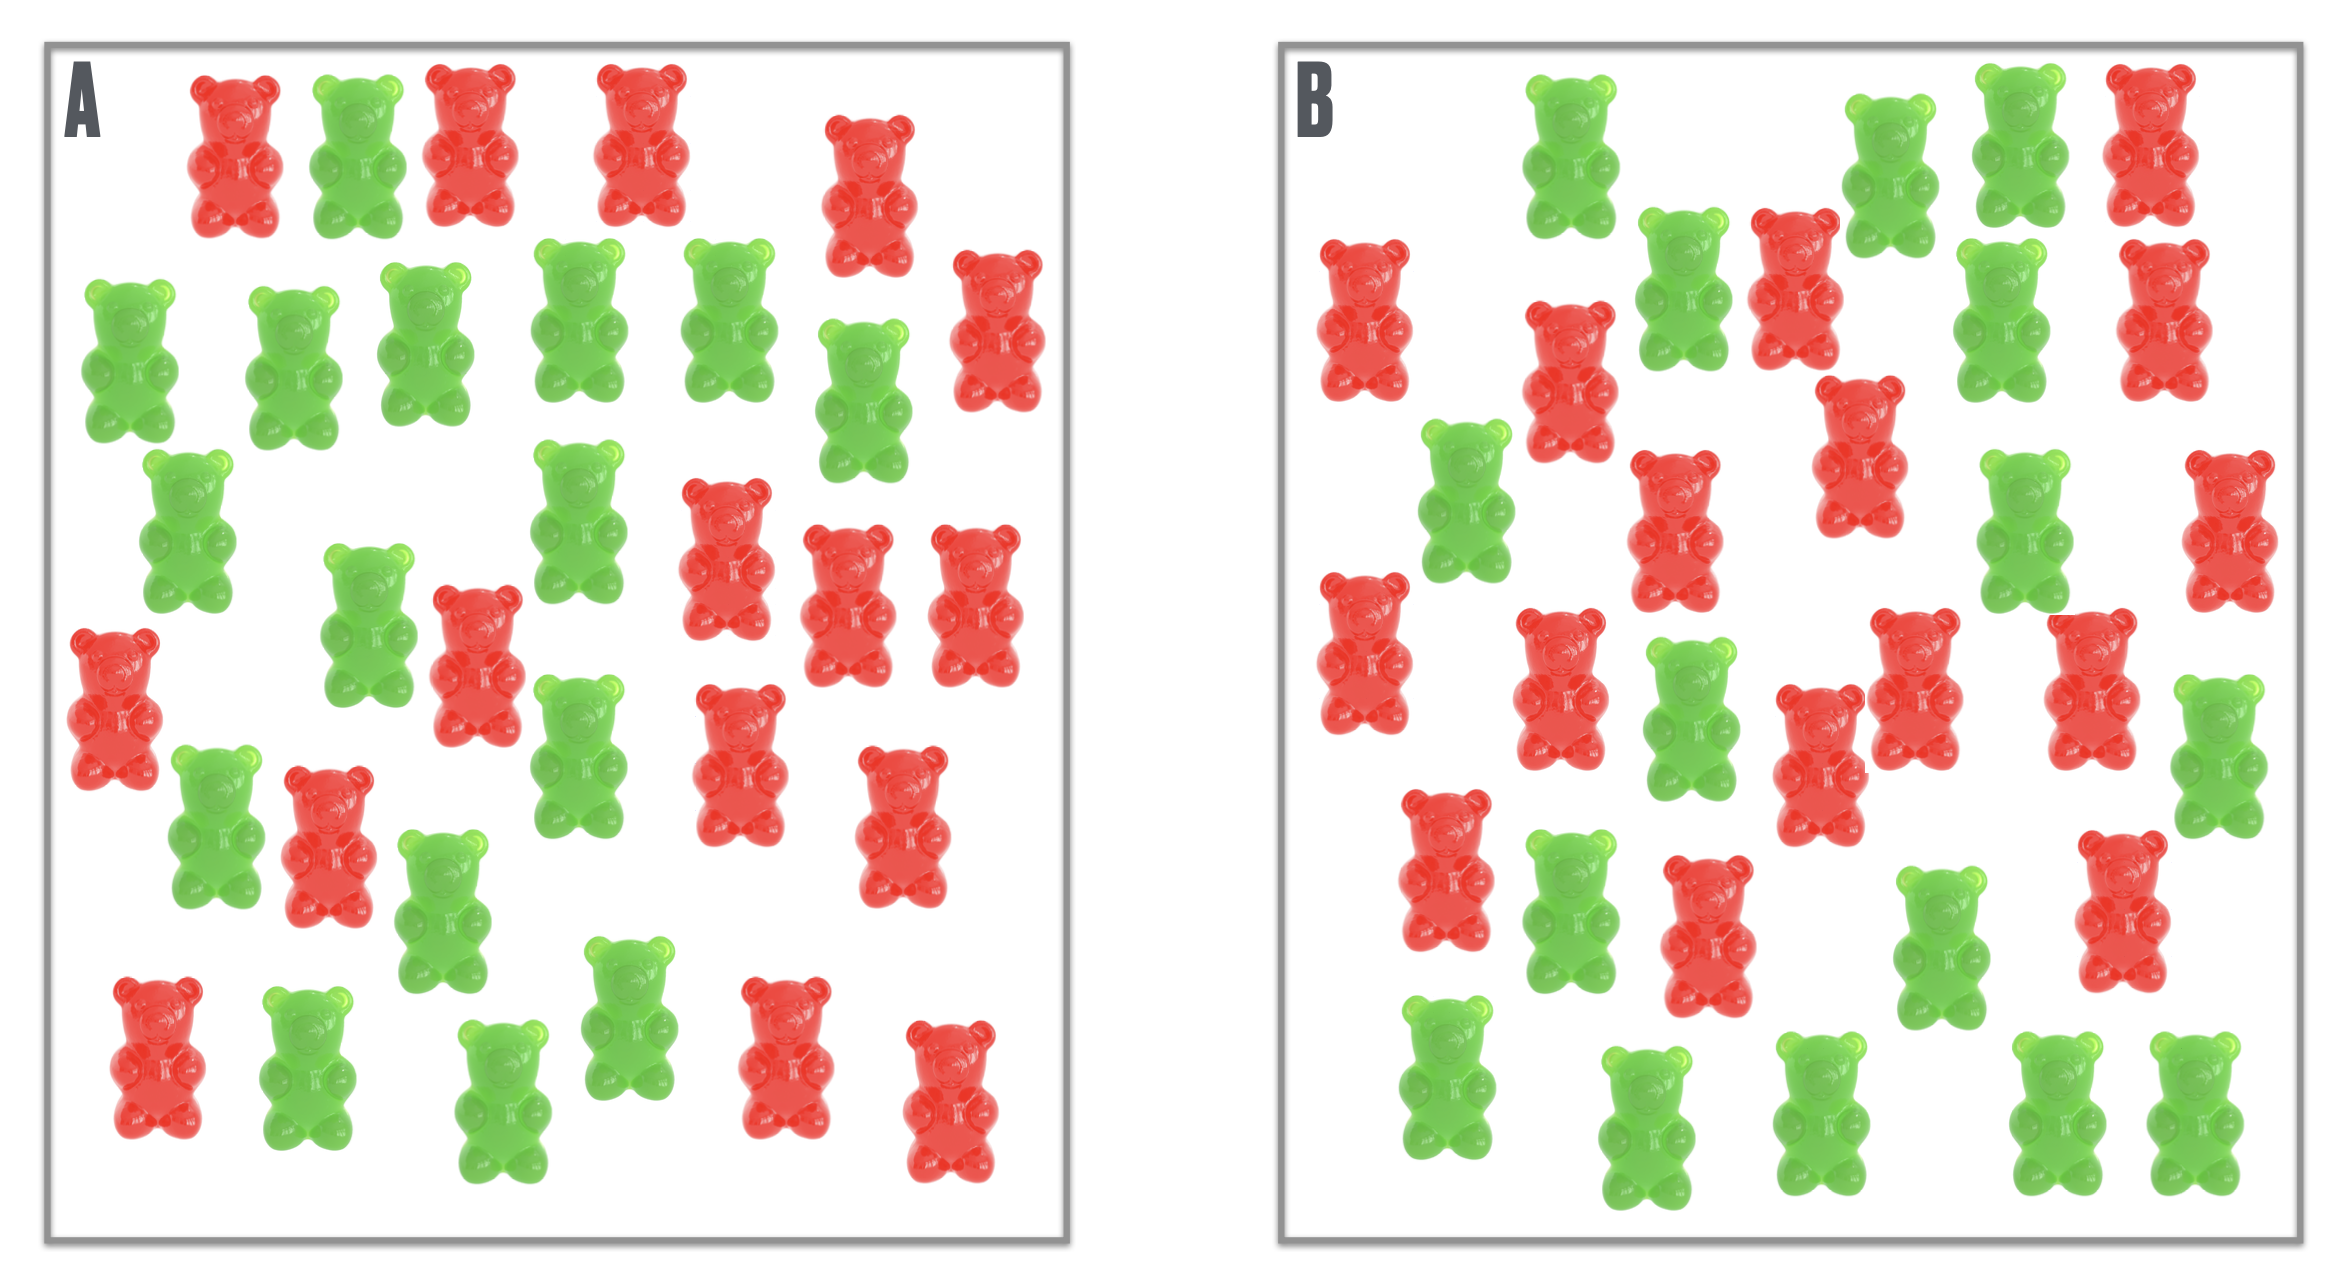
We moved on to decision making without risk (food choice) and with risk. Here I tried to show them base rate neglect with several picks of a certain gummybear color (green or red) from different distributions.
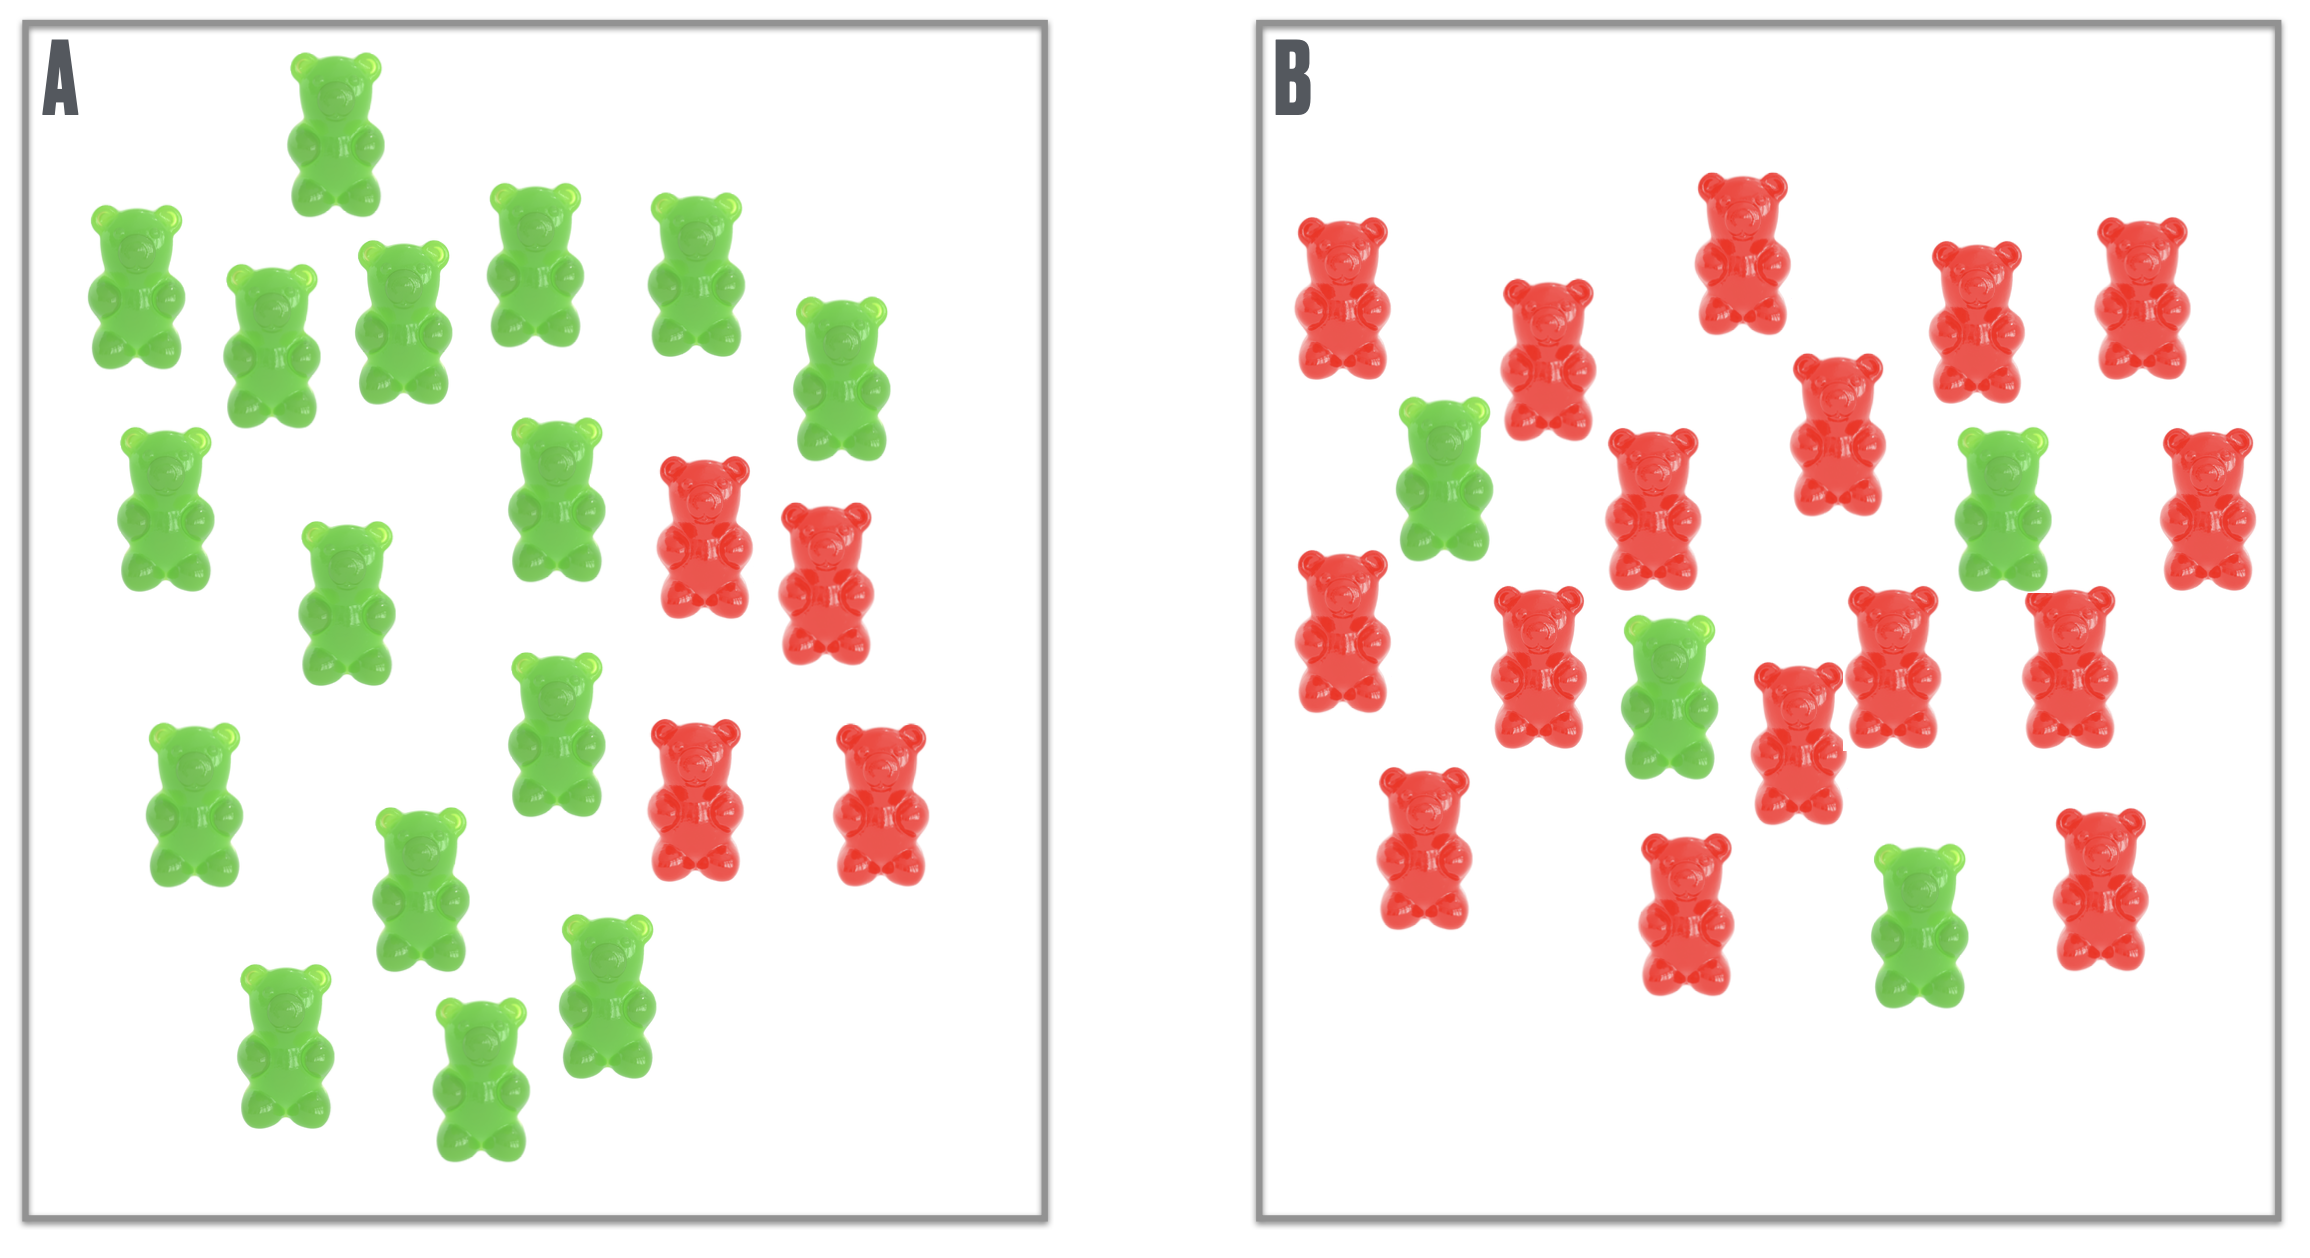
 We started out with an easy task - do you prefer A or B if you want to draw a red gummybear?
 After some further easy tasks - something more tricky - after bringing these in order, it became clear that the two distributions were the same - so same probabilities for A and B.
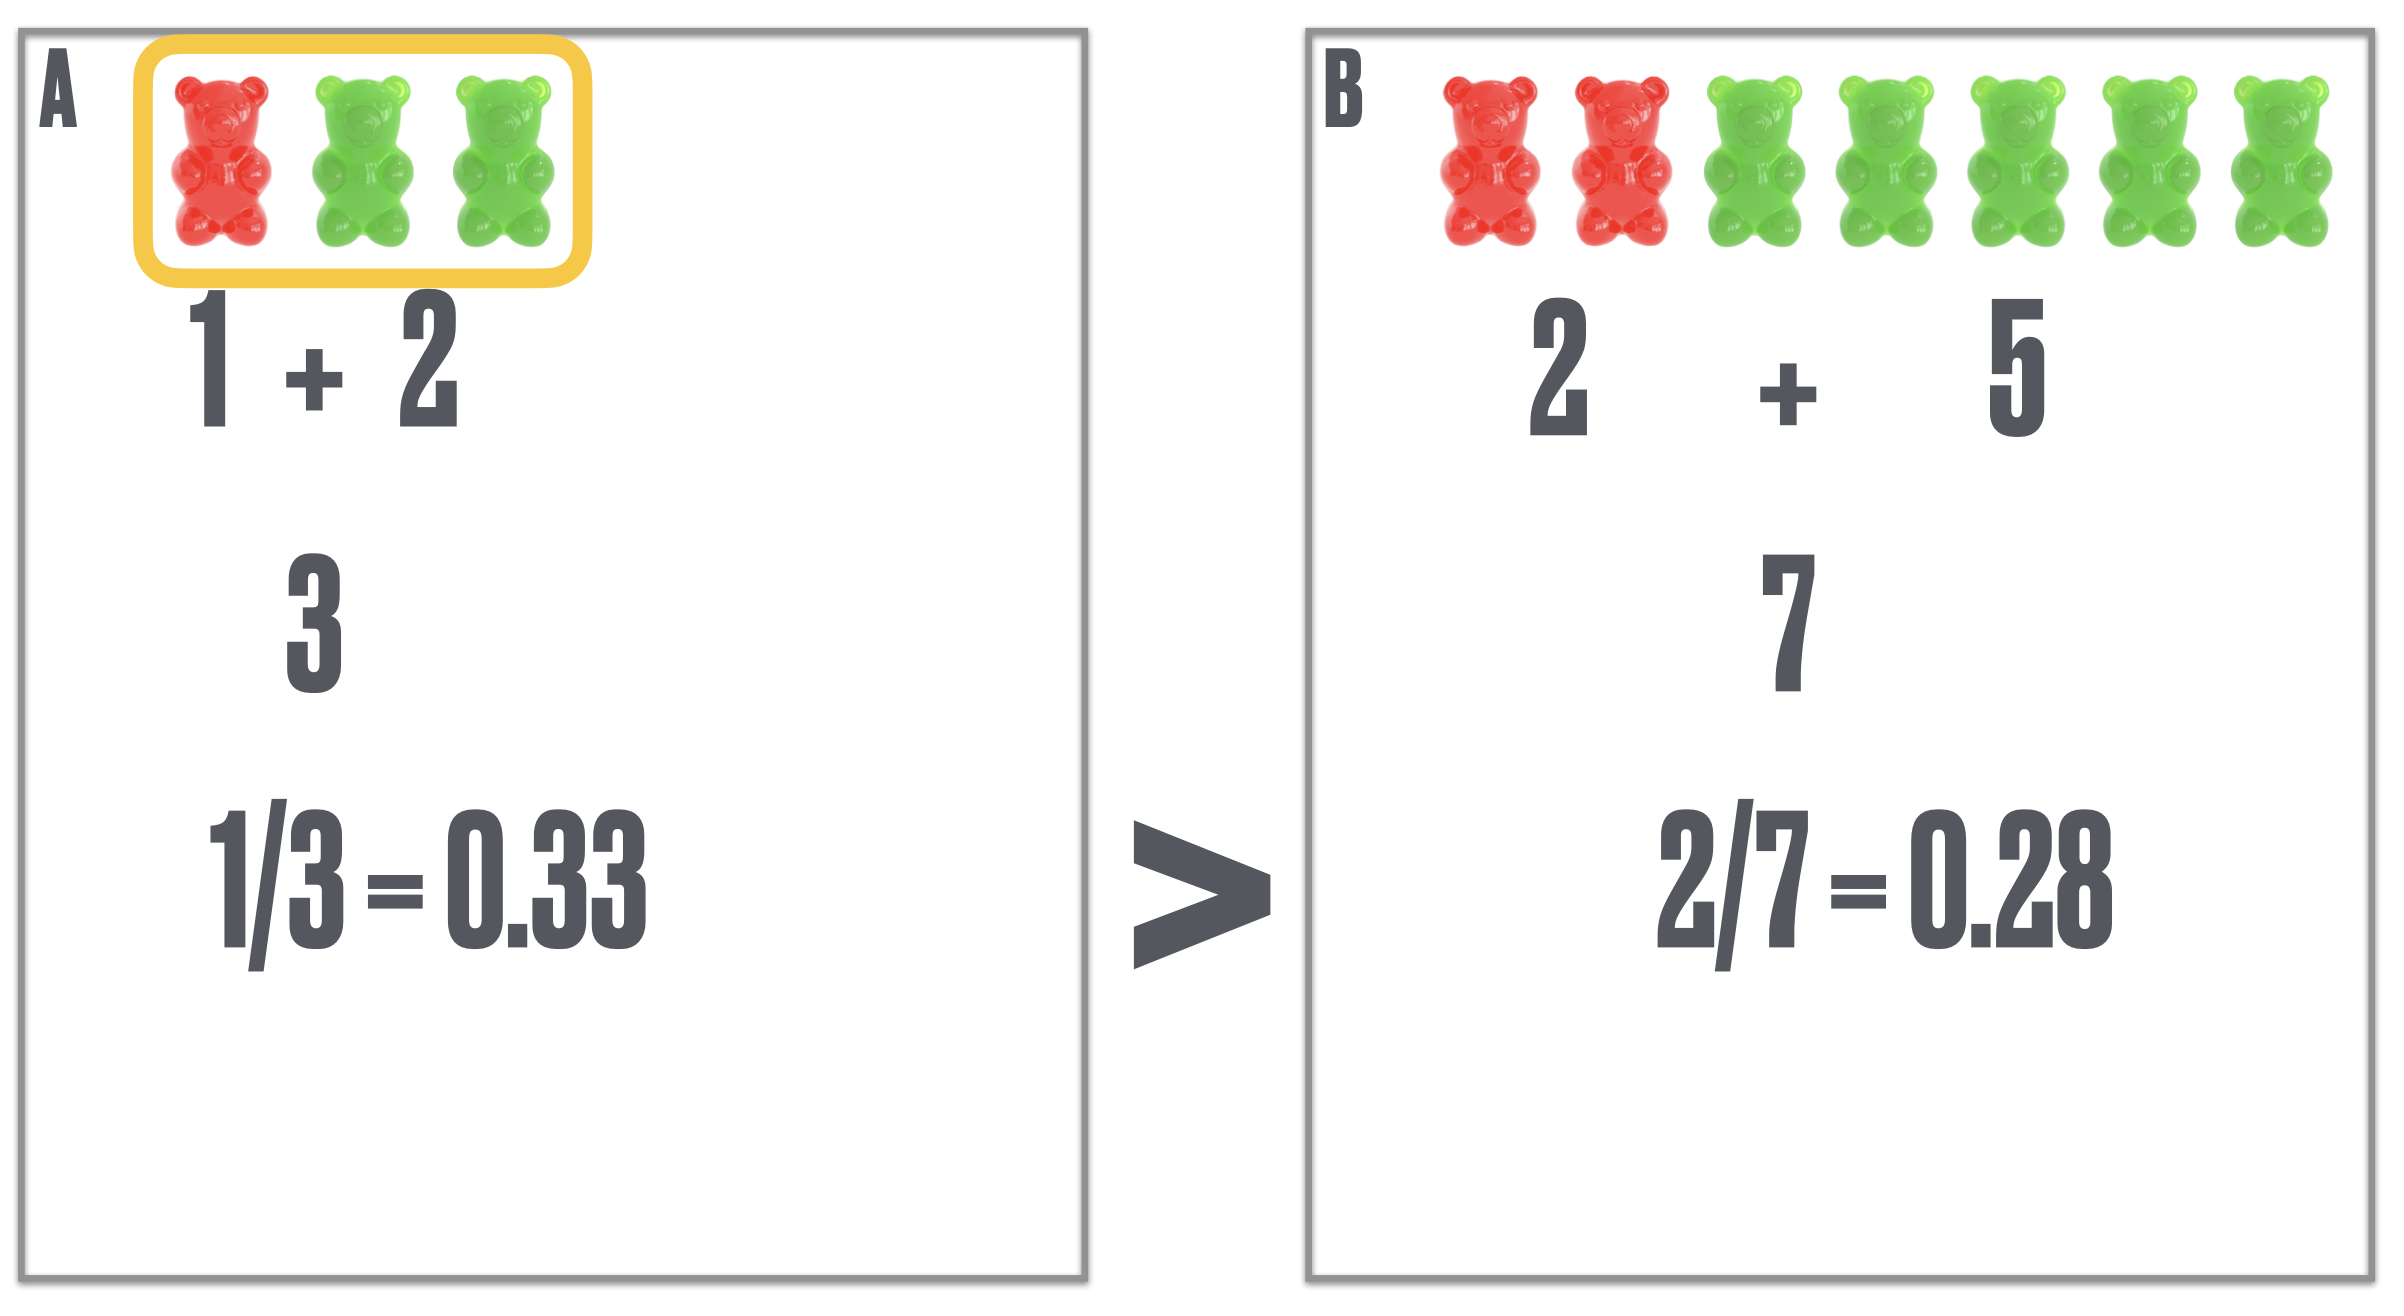
Finally the real tricky one:
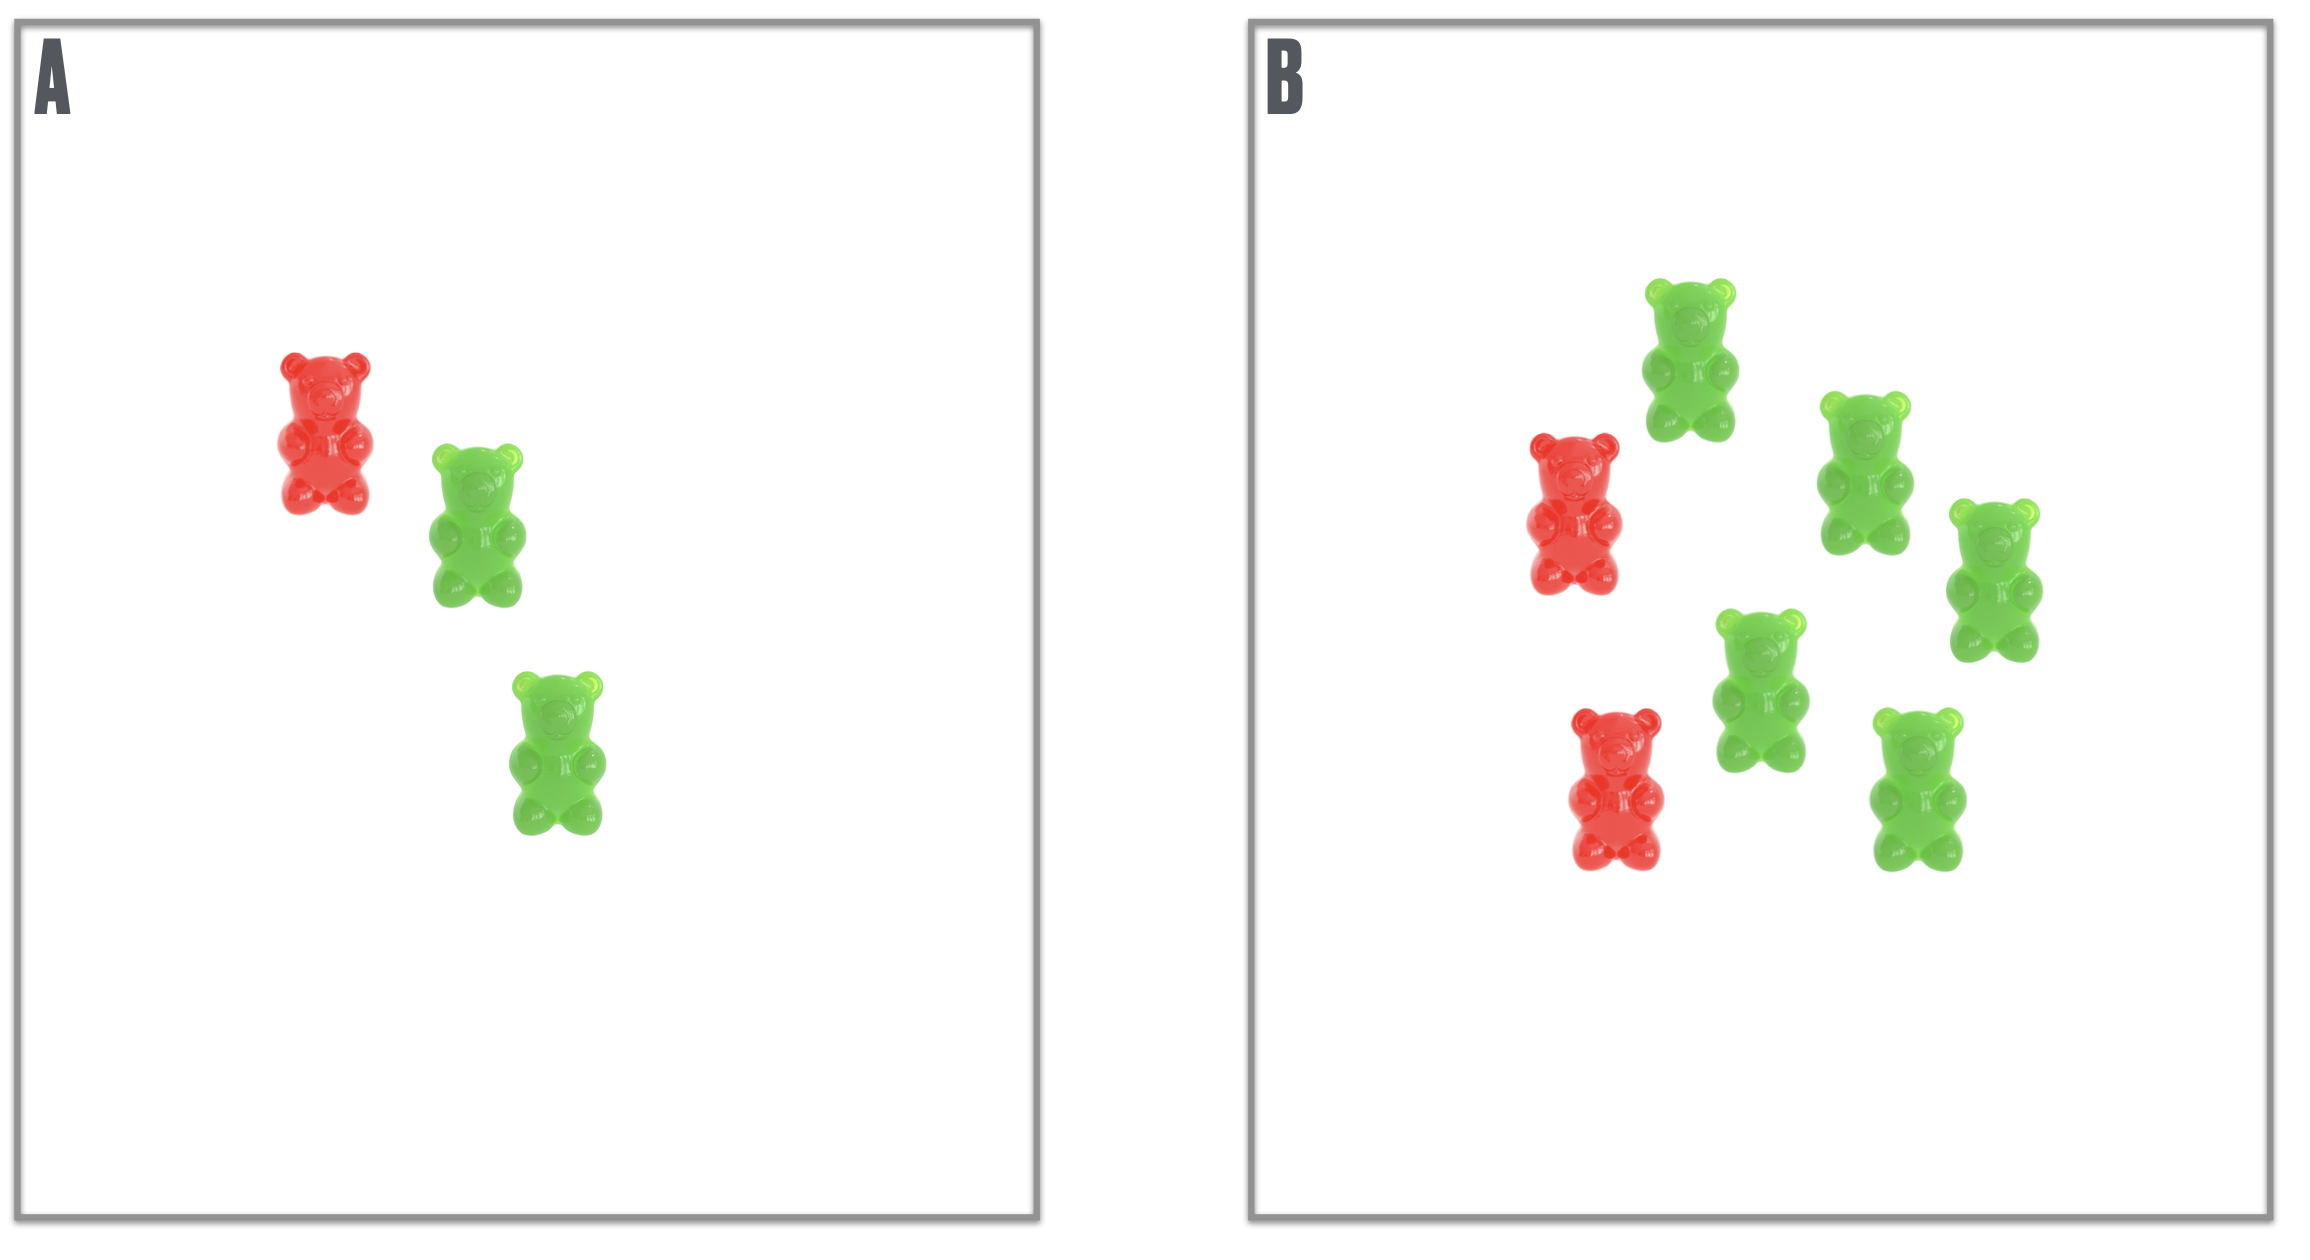
Just going with the number of red ones (if you want a red) is misleading … we do a bit of maths and decide that A is advantageous. Clearly the 8-year olds had troubles with this - but the older ones totally got my point and explained that A simply has the larger probability of a red gummybear - hence this one is preferable - again - pretty cool.
Game theory
Finally - and definitly most chaotic of all - we played two rounds of game theory. First a dictator game, imagining one of the other kids as their partner. Then I paired them up and let them play an Ultimatum game in pairs with (Sugus)[https://en.wikipedia.org/wiki/Sugus] sweets.
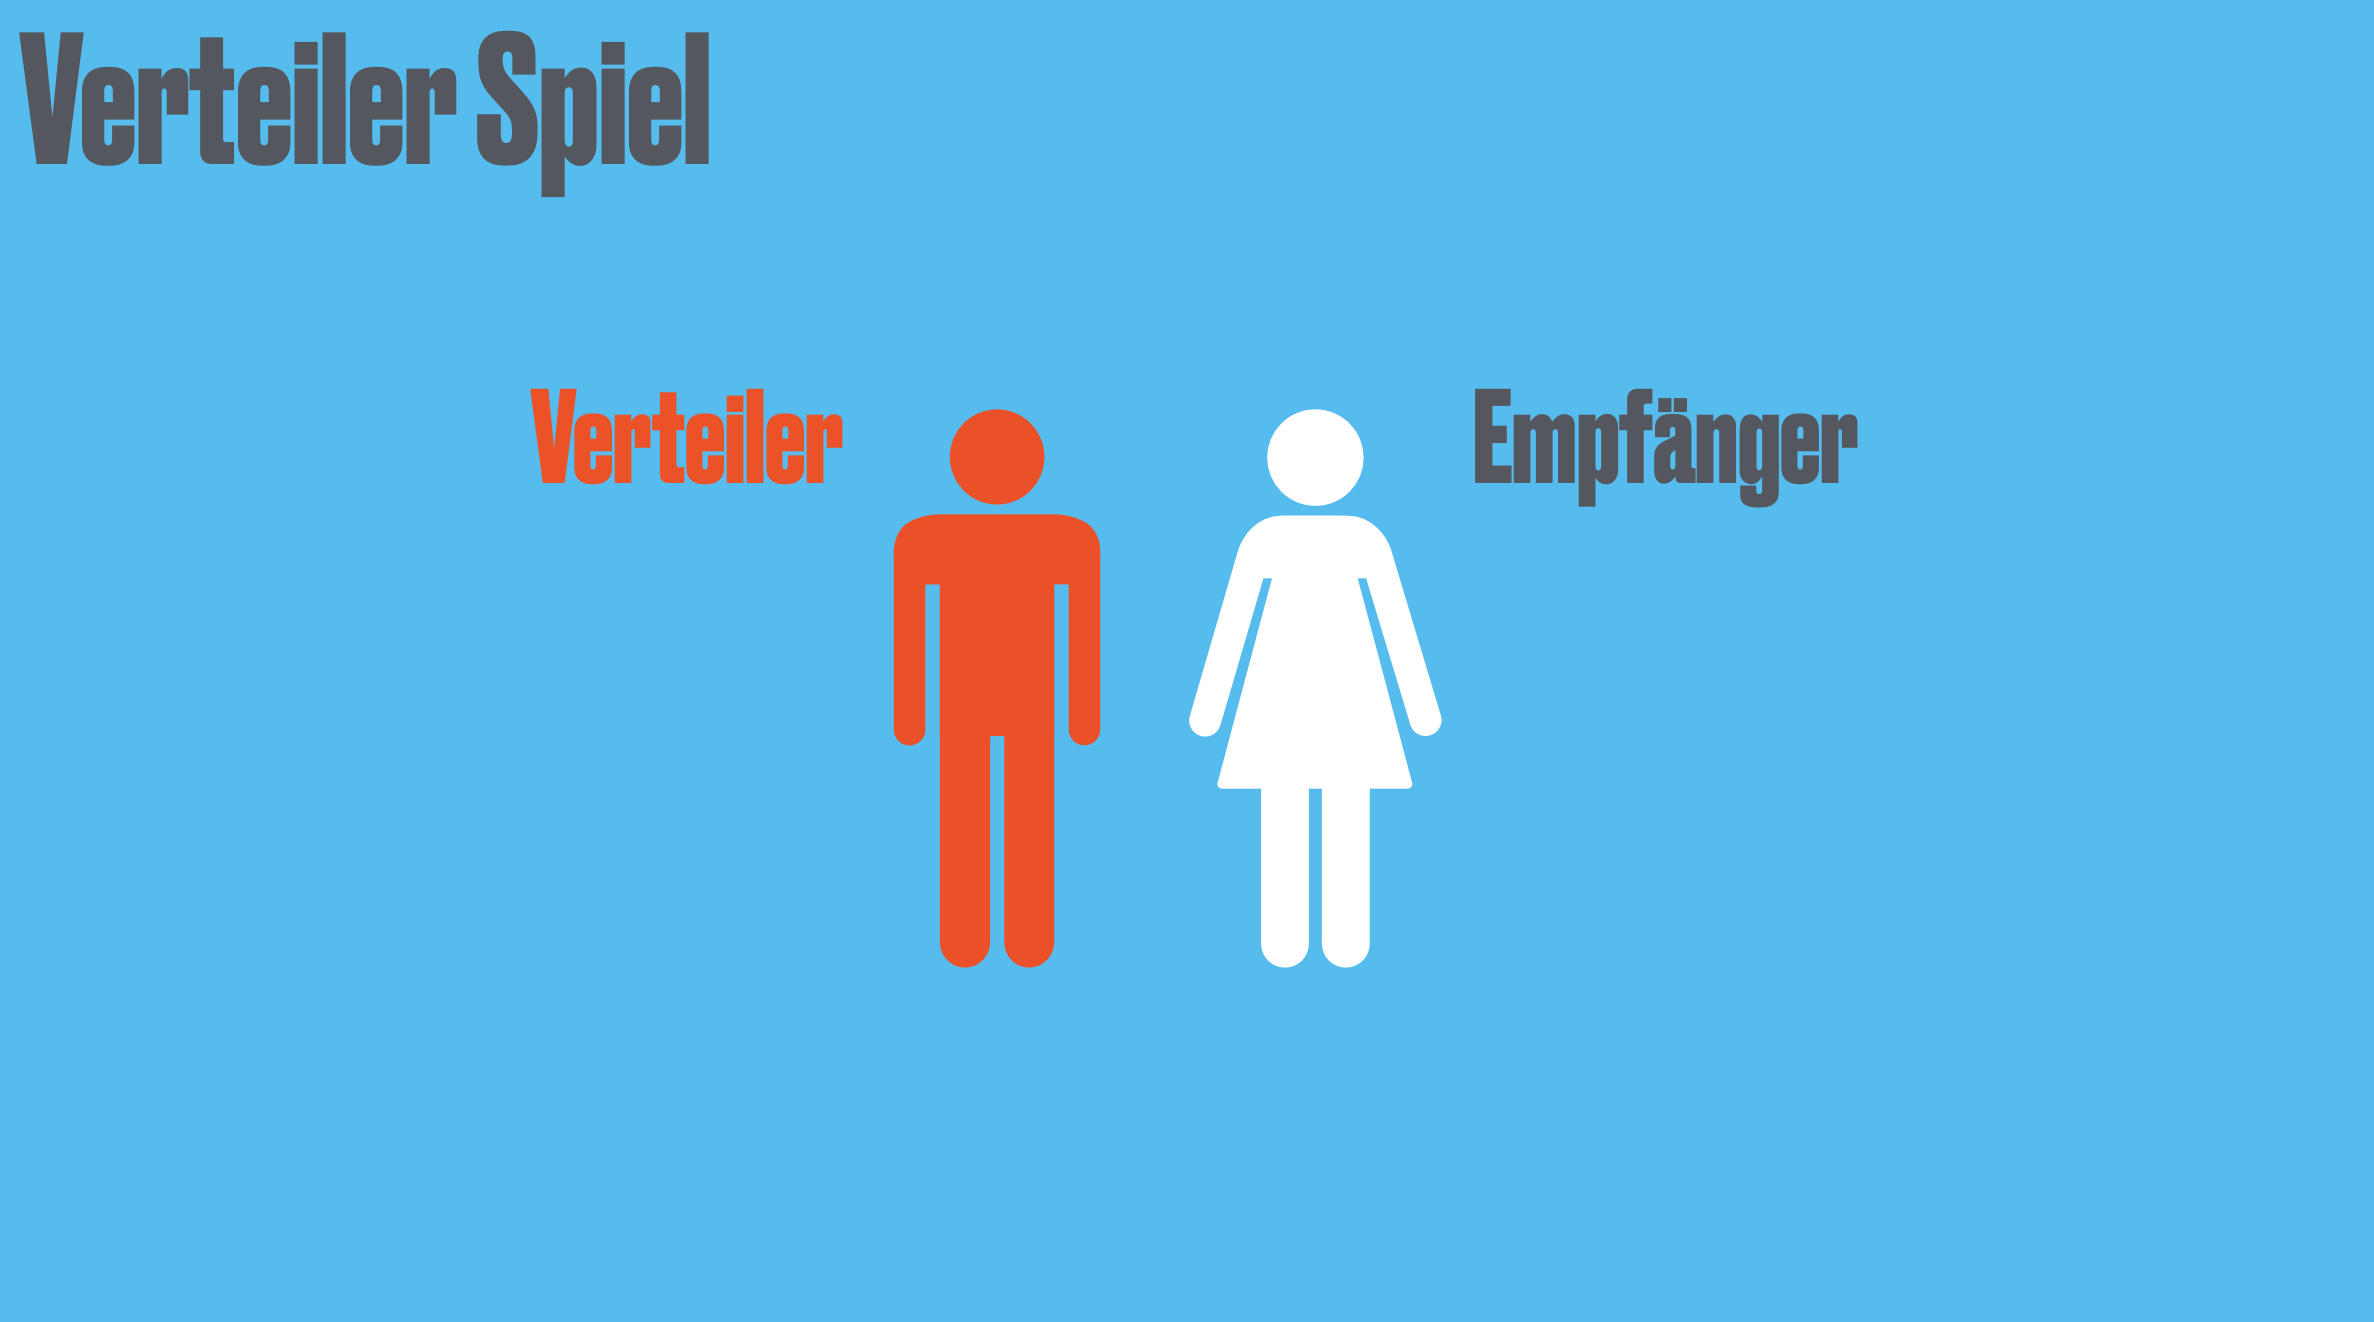
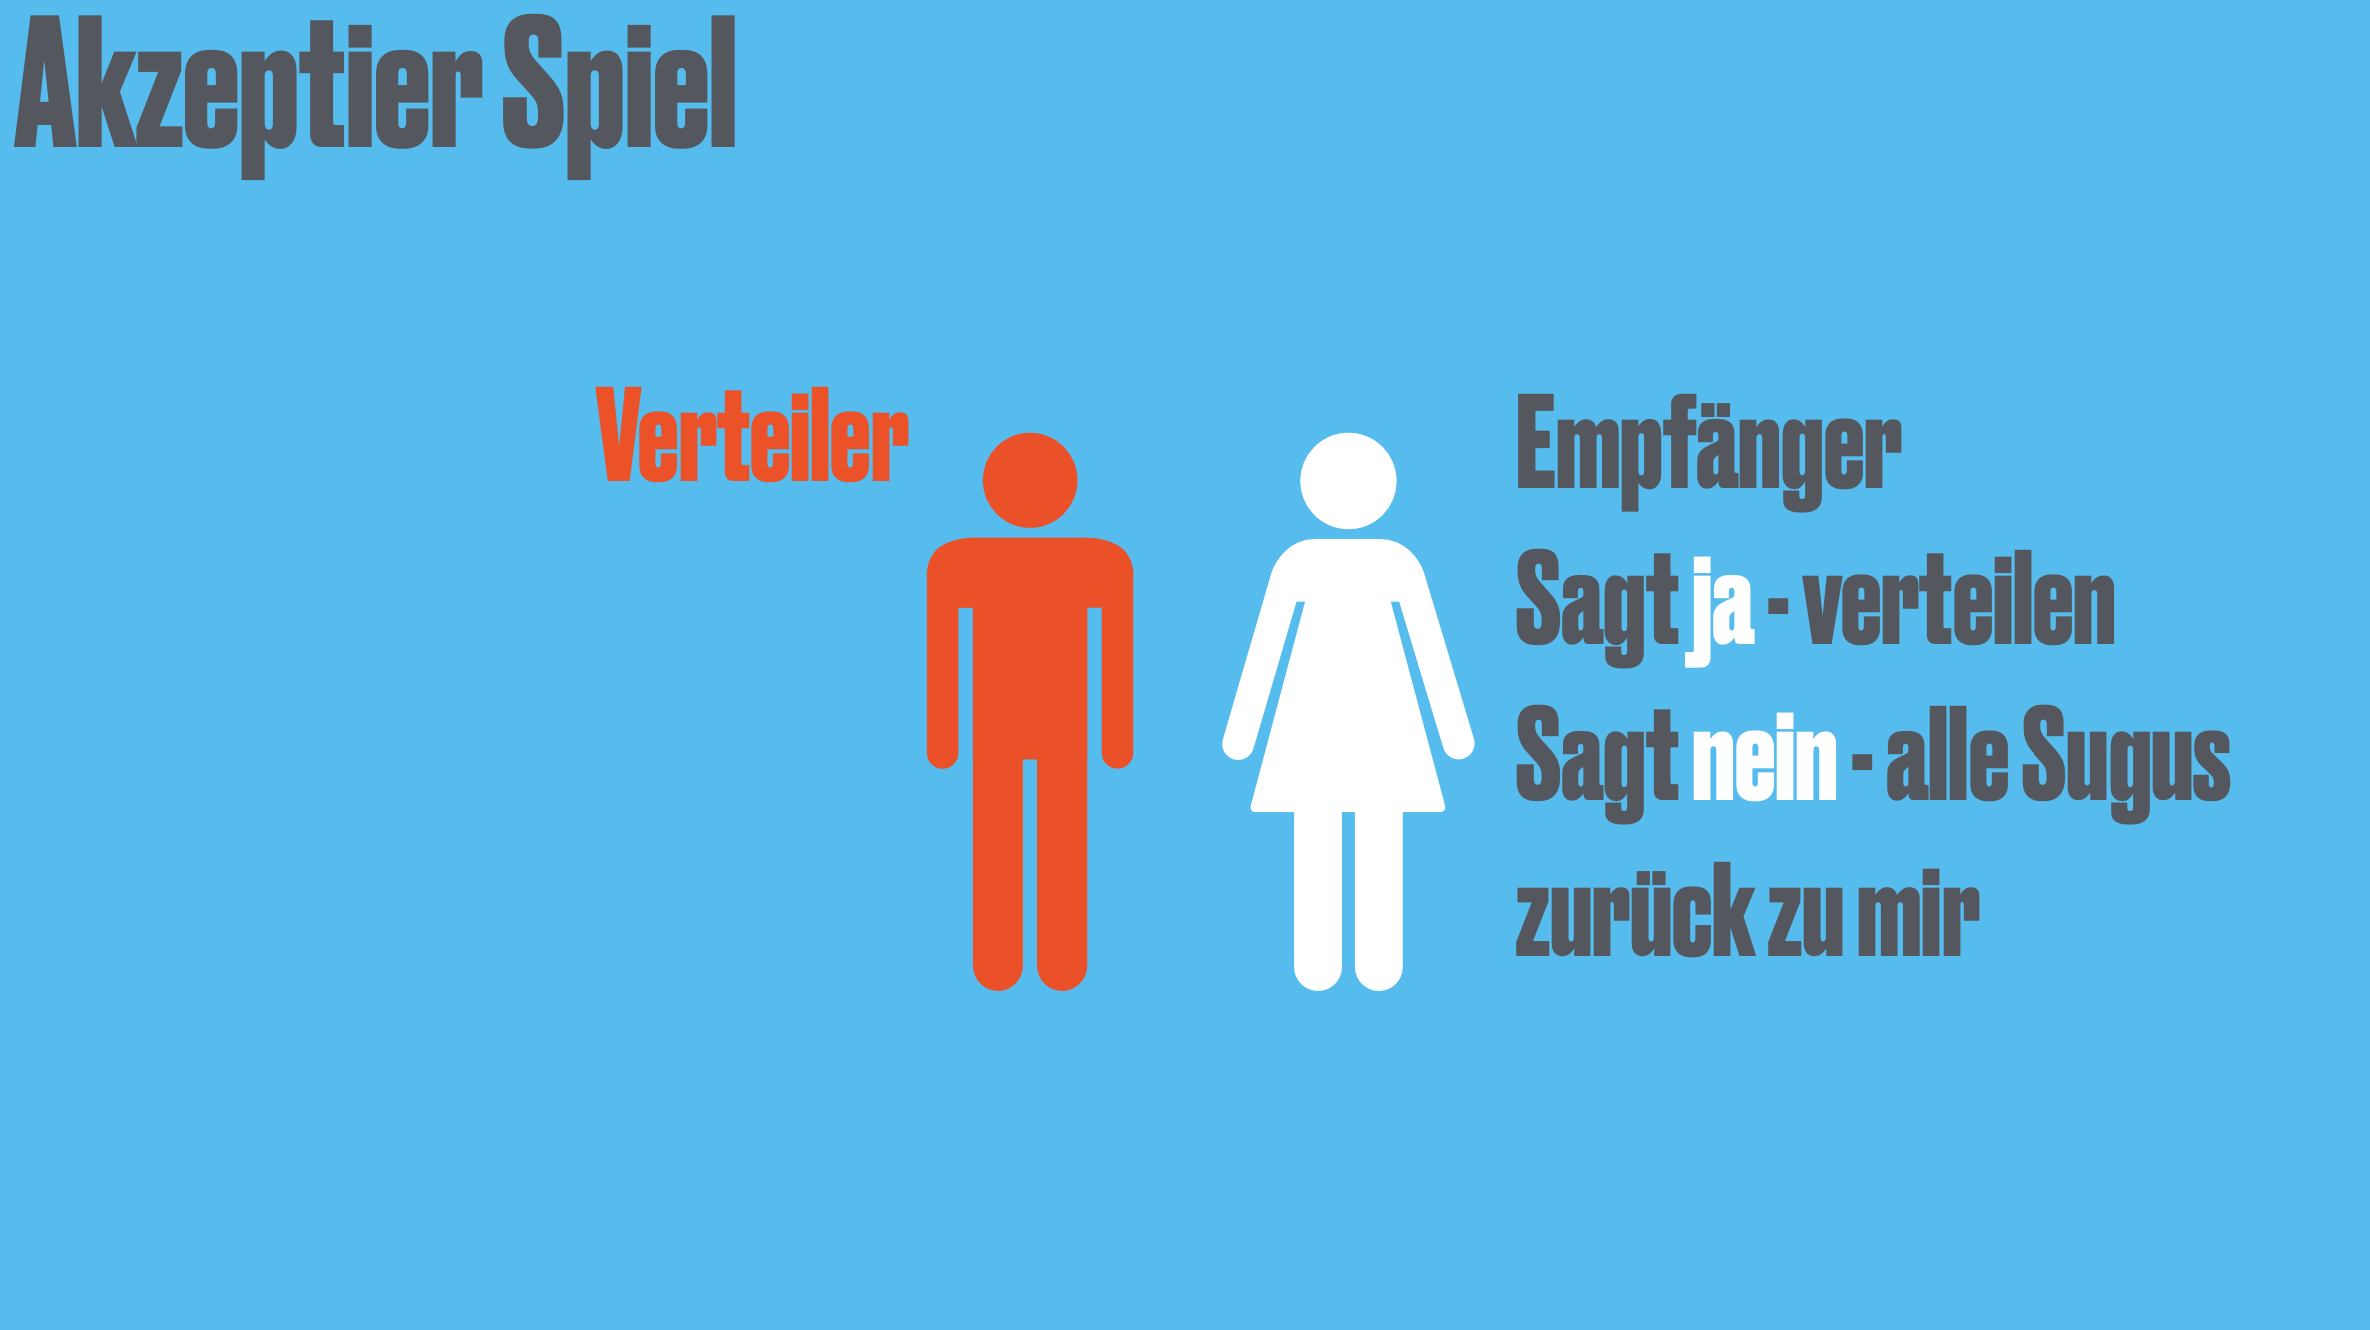
Both rounds were pretty wild but we ended up in a nice discussion on fairness - a fair offer (3:3 when 6 Sugus were distributed) was clearly identified and other cases mentioned. Some interactions ended in interesting distributions like 6:0 cause one of the two kids did not like Sugus - so well coordinated :).
Take Aways
- I was way off how long things take - favorite example: I told them to form pairs of two for the ultimatum game … it took us about 10 minutes to achive this, planned about 2 :)
- responses in paper and pencil are tricky to live analyse - I normally run FormR as a frontend and a R script in the background that analyse/visualize data automatically - easy, once setup. Here we did two things - entering values from the response papers into Google Sheets and sticking dots onto a flipchart to generate a distribution graph - both works but both takes a lot of time (even with 3 people in the room)
- Kids (at least in this class) are super responsive and engaged - I am used to getting not a lot of feedback/questions from my students - with the kids 7-10 hands are up for every questions - great, but again a time issue if you want to address the questions properly
Slides
Here is a pdf export of the Keynote slides I did.