sd_pooled <- sqrt((4.7^2 + 6.3^2)/2)
d <- (4.6 - 2.7) / sd_pooledAbstract
Understanding the role of emotion in forming preferences is critical in helping firms choose effective marketing strategies and consumers make appropriate consumption decisions. In five experiments, participants made a set of binary product choices under conditions designed to induce different degrees of emotional decision processing. The results consistently indicate that greater reliance on emotional reactions during decision making is associated with greater preference consistency and less cognitive noise. Additionally, the results of a meta-analytical study based on data from all five experiments further show that products that elicit a stronger emotional response are more likely to yield consistent preferences.
Team Bachelor Autumn 2021
- Michael Amherd
- Patrick Bargetze
- Paco Buxtorf
- Anja Grossrieder
- Jana Portmann
- Cedric Thommen
Original work
Lee, L., Amir, O., & Ariely, D. (2009). In search of homo economicus: Cognitive noise and the role of emotion in preference consistency.
Demographics
We sampled 150 participants (44% female, 1% did not specify gender), with an average age M = 44.4, SD = 11.3 years. Participants were recruited via Amazon Mechanical Turk (AMT) and paid a flat fee of USD 7.25/hour for completing the task.
Method
We replicated Experiment 1a PICTURES VERSUS NAMES and Experiment 2 COLOR VERSUS BLACK- AND-WHITE PICTURES. Participants were randomly assigned to one of the two experiments, giving us 75 participants per experiment and ~37 per condition.
Participants first inspected information about 10 consumer items (see example below) including the name of the product, a picture and a short description. Participants were asked to study the products as long as they wanted.
Out of the 10 products we generated a list of 45 pairwise choice with all possible combinations of products, where
\(combinations = {P*(P-1) \over 2}\)
hence, 45 combinations.
Each participant then went through these 45 choices indicating her preference between the shown product. As indicated above, we replicated two experiments (1a and 2) with the following variations. In 1a the choice list consisted out of product pictures only (picture) or product names only (names); in 2 pictures were either in color (color) or black and white (b&w). Both manipulations represent different degrees of emotional and cognitive approaches to decision making.
Analysis
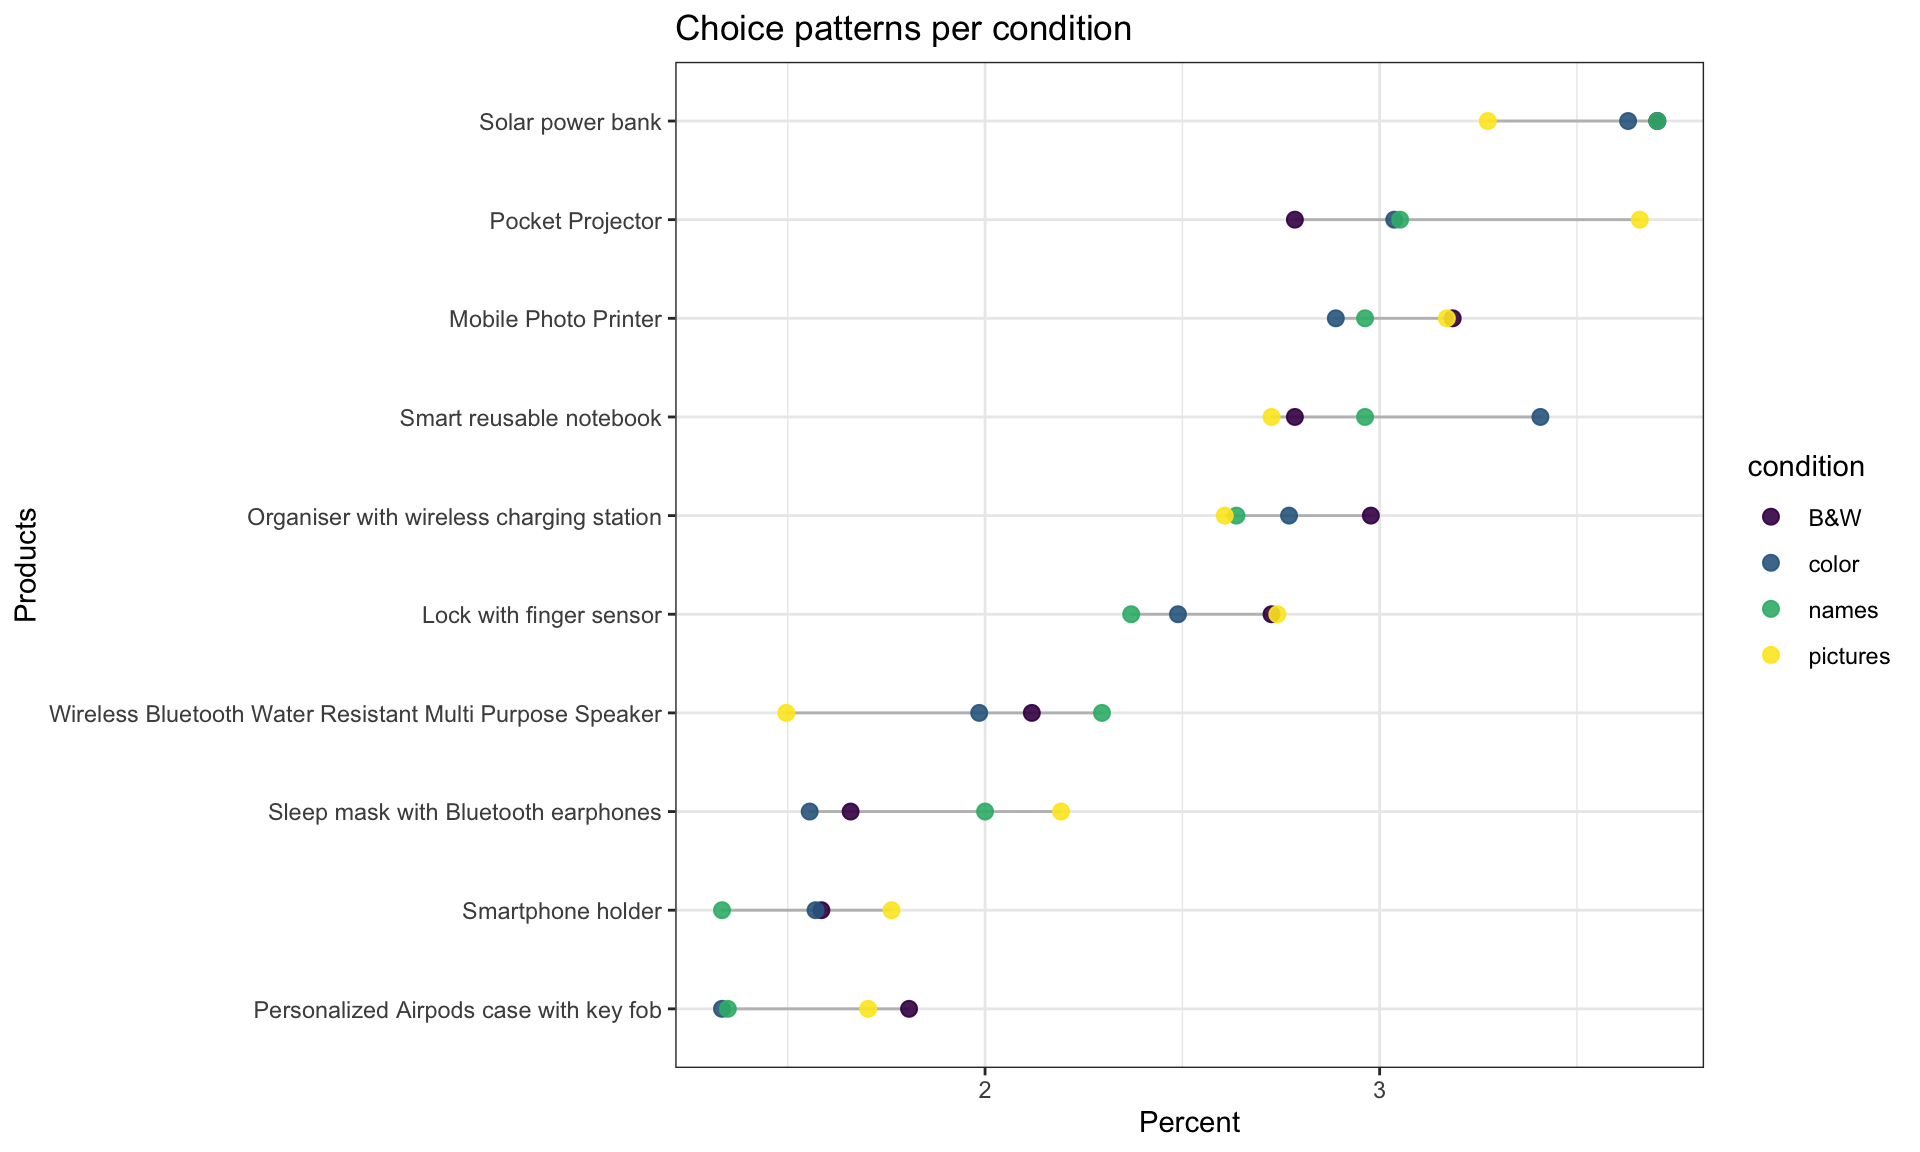
As the dependent measure we calculated (in)consistency in choice patterns.
Experiment 1a picture v names
Lee and colleagues report significant fewer transitivity violations in the picture condition (M = 2.7, SD = 4.7) than in the names condition (M = 4.6, SD = 6.3, t(532) = 4.08, p < .001). Using the formula for Cohen’s d we want to calculate:
\(d = {M_{2} - M_{1} \over SD_{pooled}}\)
where
\(SD_{pooled} = {\sqrt{SD_{1}^2 + SD_{2}^2} \over 2}\)
So, we get a Cohen’s d = 0.34, which constitutes a small effect according to Cohen, 1992. Lets see how our own replication does for Experiment 1a.
Our 150 participants each made 45 choices, so we are expecting a tibble with 150*45 = 6750 rows. Lets see:
# generate data frame for choices
Lee_Choice_Coded <-
Lee_Choice %>%
  left_join(Lee_Items) %>%
  mutate(combi1 = str_extract(combi1, pattern = "(\\d)+"),
         combi2 = str_extract(combi2, pattern = "(\\d)+"),
         combination = paste0(combi1, combi2))

# subset relevant variables data frame
Lee_Choice_Select <-
   Lee_Choice_Coded %>%
   select(Experiment, condition, ID, combination, coded_choice)
Lee_Choice_Select
# A tibble: 6,750 × 5
Experiment condition ID combination coded_choice
<chr> <chr> <chr> <chr> <int>
1 Lee2 pictures 8Y3uw8Wz 12 2
2 Lee2 pictures 8Y3uw8Wz 13 3
3 Lee2 pictures 8Y3uw8Wz 14 4
4 Lee2 pictures 8Y3uw8Wz 15 5
5 Lee2 pictures 8Y3uw8Wz 16 1
6 Lee2 pictures 8Y3uw8Wz 17 7
7 Lee2 pictures 8Y3uw8Wz 18 8
8 Lee2 pictures 8Y3uw8Wz 19 1
9 Lee2 pictures 8Y3uw8Wz 110 1
10 Lee2 pictures 8Y3uw8Wz 23 3
# … with 6,740 more rowsFor both experiments (1a and 2) we have for each condition (condition) and participant (ID) the relevant item comparison (combination) and 45 responses (coded_choice, a numeric value for each possible answer, as described in Lee_Items). Note that we updated the items to something more relevant these days.
Check for transitivity
Lee et al. write on p. 176 “For simplicity in reporting the results, we focus on violations in the form of three-way preference cycles (e.g., \(p_{x} ≥ p_{y}, p_{y} ≥ p_{z}\) and \(p_{z} ≥ p_{x}\))”
So, we will do the same :) - first we setup a tibble with all possible triplets and then identify (in)transitivity for choices on each product pair and then pair-triplets.
gtools provides functions to “Enumerate the Combinations or Permutations of the Elements of a Vector” - cool - exactly what we need … The function takes two arguments n = the size of the source vector, in our case 10 products, and r = size of the target vector, our triplets. This gives us a 720x3 matrix (only the first 5 rows displayed here).
# generate combinations
comb <- permutations(n = 10, r = 3)
head(comb, 5)
[,1] [,2] [,3]
[1,] 1 2 3
[2,] 1 2 4
[3,] 1 2 5
[4,] 1 2 6
[5,] 1 2 7We transfer the matrix into a tibble and paste together all combinations of products - so there are three pairs that identify the three combinations of products. The new variable defines all transitive choices for all possible permutations of choice pairs.
# generate space with all possible choice combinations
space <-
as_tibble(comb) %>%
  mutate(pair1 = paste0(V1,V2),
         pair2 = paste0(V2,V3),
         pair3 = paste0(V1,V3),
         transitive = paste0(V1,V2,V1)) %>%
  select(-starts_with('V'))
space
# A tibble: 720 × 4
pair1 pair2 pair3 transitive
<chr> <chr> <chr> <chr>
1 12 23 13 121
2 12 24 14 121
3 12 25 15 121
4 12 26 16 121
5 12 27 17 121
6 12 28 18 121
7 12 29 19 121
8 12 210 110 121
9 13 32 12 131
10 13 34 14 131
# … with 710 more rowsNow for some joining. We want to join the actual choices of each participant back into the matrix we generated above, with all the permutations of my 10 items. This is a little step by step operation, cause we want to join based on three different variables (pairs 1, 2 and 3). The first join is straight forward, for every row in pair 1 match the choice (and all other information about participants, experiment etc) from Lee_Choice_Coded, then rename the coded_choice variable and go on and match on pair2 now - note that we add ID and condition (although ID should be enough?), rename again and then match based on pair3.
# A tibble: 54,360 × 10
pair1 pair2 pair3 transitive Experiment condi…¹ ID coded…² coded…³ coded…⁴
<chr> <chr> <chr> <chr> <chr> <chr> <chr> <int> <int> <int>
1 12 23 13 121 Lee2 pictur… 8Y3u… 2 3 3
2 12 23 13 121 Lee4 B&W D9JS… 2 2 3
3 12 23 13 121 Lee4 B&W 3iTJ… 2 2 3
4 12 23 13 121 Lee2 pictur… 47Z1… 2 2 3
5 12 23 13 121 Lee3 color KLMD… 2 3 3
6 12 23 13 121 L1a names ZVQF… 2 2 3
7 12 23 13 121 Lee4 B&W u0L1… 2 2 3
8 12 23 13 121 Lee2 pictur… nOff… 2 2 1
9 12 23 13 121 Lee3 color Hstl… 2 2 3
10 12 23 13 121 L1a names zEAh… 2 3 3
# … with 54,350 more rows, and abbreviated variable names ¹condition,
# ²coded_choice1, ³coded_choice2, ⁴coded_choice3So, that looks about right - what is left to do is to paste together the actual choices and then test these choice triples coded_choice_triple against the transitive variable we generated above - which gives us a logical vector called test.
# A tibble: 54,360 × 6
   transitive Experiment condition ID       choice_triple test
   <chr>      <chr>      <chr>     <chr>    <chr>         <lgl>
 1 121        Lee2       pictures  8Y3uw8Wz 233           FALSE
 2 121        Lee4       B&W       D9JSme3C 223           FALSE
 3 121        Lee4       B&W       3iTJmoTV 223           FALSE
 4 121        Lee2       pictures  47Z1QWBC 223           FALSE
 5 121        Lee3       color     KLMDkXi9 233           FALSE
 6 121        L1a        names     ZVQFirwo 223           FALSE
 7 121        Lee4       B&W       u0L1YrCo 223           FALSE
 8 121        Lee2       pictures  nOffEONb 221           FALSE
 9 121        Lee3       color     Hstldczk 223           FALSE
10 121        L1a        names     zEAhW9Wh 233           FALSE
# … with 54,350 more rows
# A tibble: 5 × 4
# Groups: Experiment [5]
Experiment condition av_intrans sd_intrans
<chr> <chr> <dbl> <dbl>
1 L1a names 53.1 24.2
2 Lee2 pictures 49.9 28.0
3 Lee3 color 47.0 23.5
4 Lee4 B&W 46.7 29.3
5 <NA> <NA> 100 NA Test Experiment 1
We run two t-tests. For Experiment 1: names v. pictures.
    Welch Two Sample t-test

data:  intransitive by condition
t = 0.52209, df = 72.026, p-value = 0.6032
alternative hypothesis: true difference in means between group names and group pictures is not equal to 0
95 percent confidence interval:
 -3.996787  6.833203
sample estimates:
   mean in group names mean in group pictures
              23.89189               22.47368
Cohen's d

d estimate: 0.1203499 (negligible)
95 percent confidence interval:
     lower      upper
-0.3403704  0.5810702
Test Experiment 2
A second one for Experiment 2: color v. B&W
    Welch Two Sample t-test

data:  intransitive by condition
t = -0.039508, df = 70.46, p-value = 0.9686
alternative hypothesis: true difference in means between group B&W and group color is not equal to 0
95 percent confidence interval:
 -5.601652  5.384013
sample estimates:
  mean in group B&W mean in group color
           21.02632            21.13514
Cohen's d

d estimate: -0.009098058 (negligible)
95 percent confidence interval:
     lower      upper
-0.4694043  0.4512082
In the two ways we look at the two experiments - t-test significance and Cohen’s d - well, there is not a lot going on in our replication - we get non-significant results for both Tests and negligible effect sizes.
References
Lee, L., Amir, O., & Ariely, D. (2009). In search of homo economicus: Cognitive noise and the role of emotion in preference consistency. Journal of consumer research, 36(2), 173-187. DOI