As mentioned some days ago our Handbook of Process Tracing Methods is out in the wild …
Here is a bit of an overview of what is going on inside :)
The book has 390 pages divided into 24 chapters. There are 202014 words in there including everything (references, thanks, hello, goodbye …).
Ignoring the chapters and that they have reference lists, that mess up things a bit, first an overview of frequency for highly frequent words:
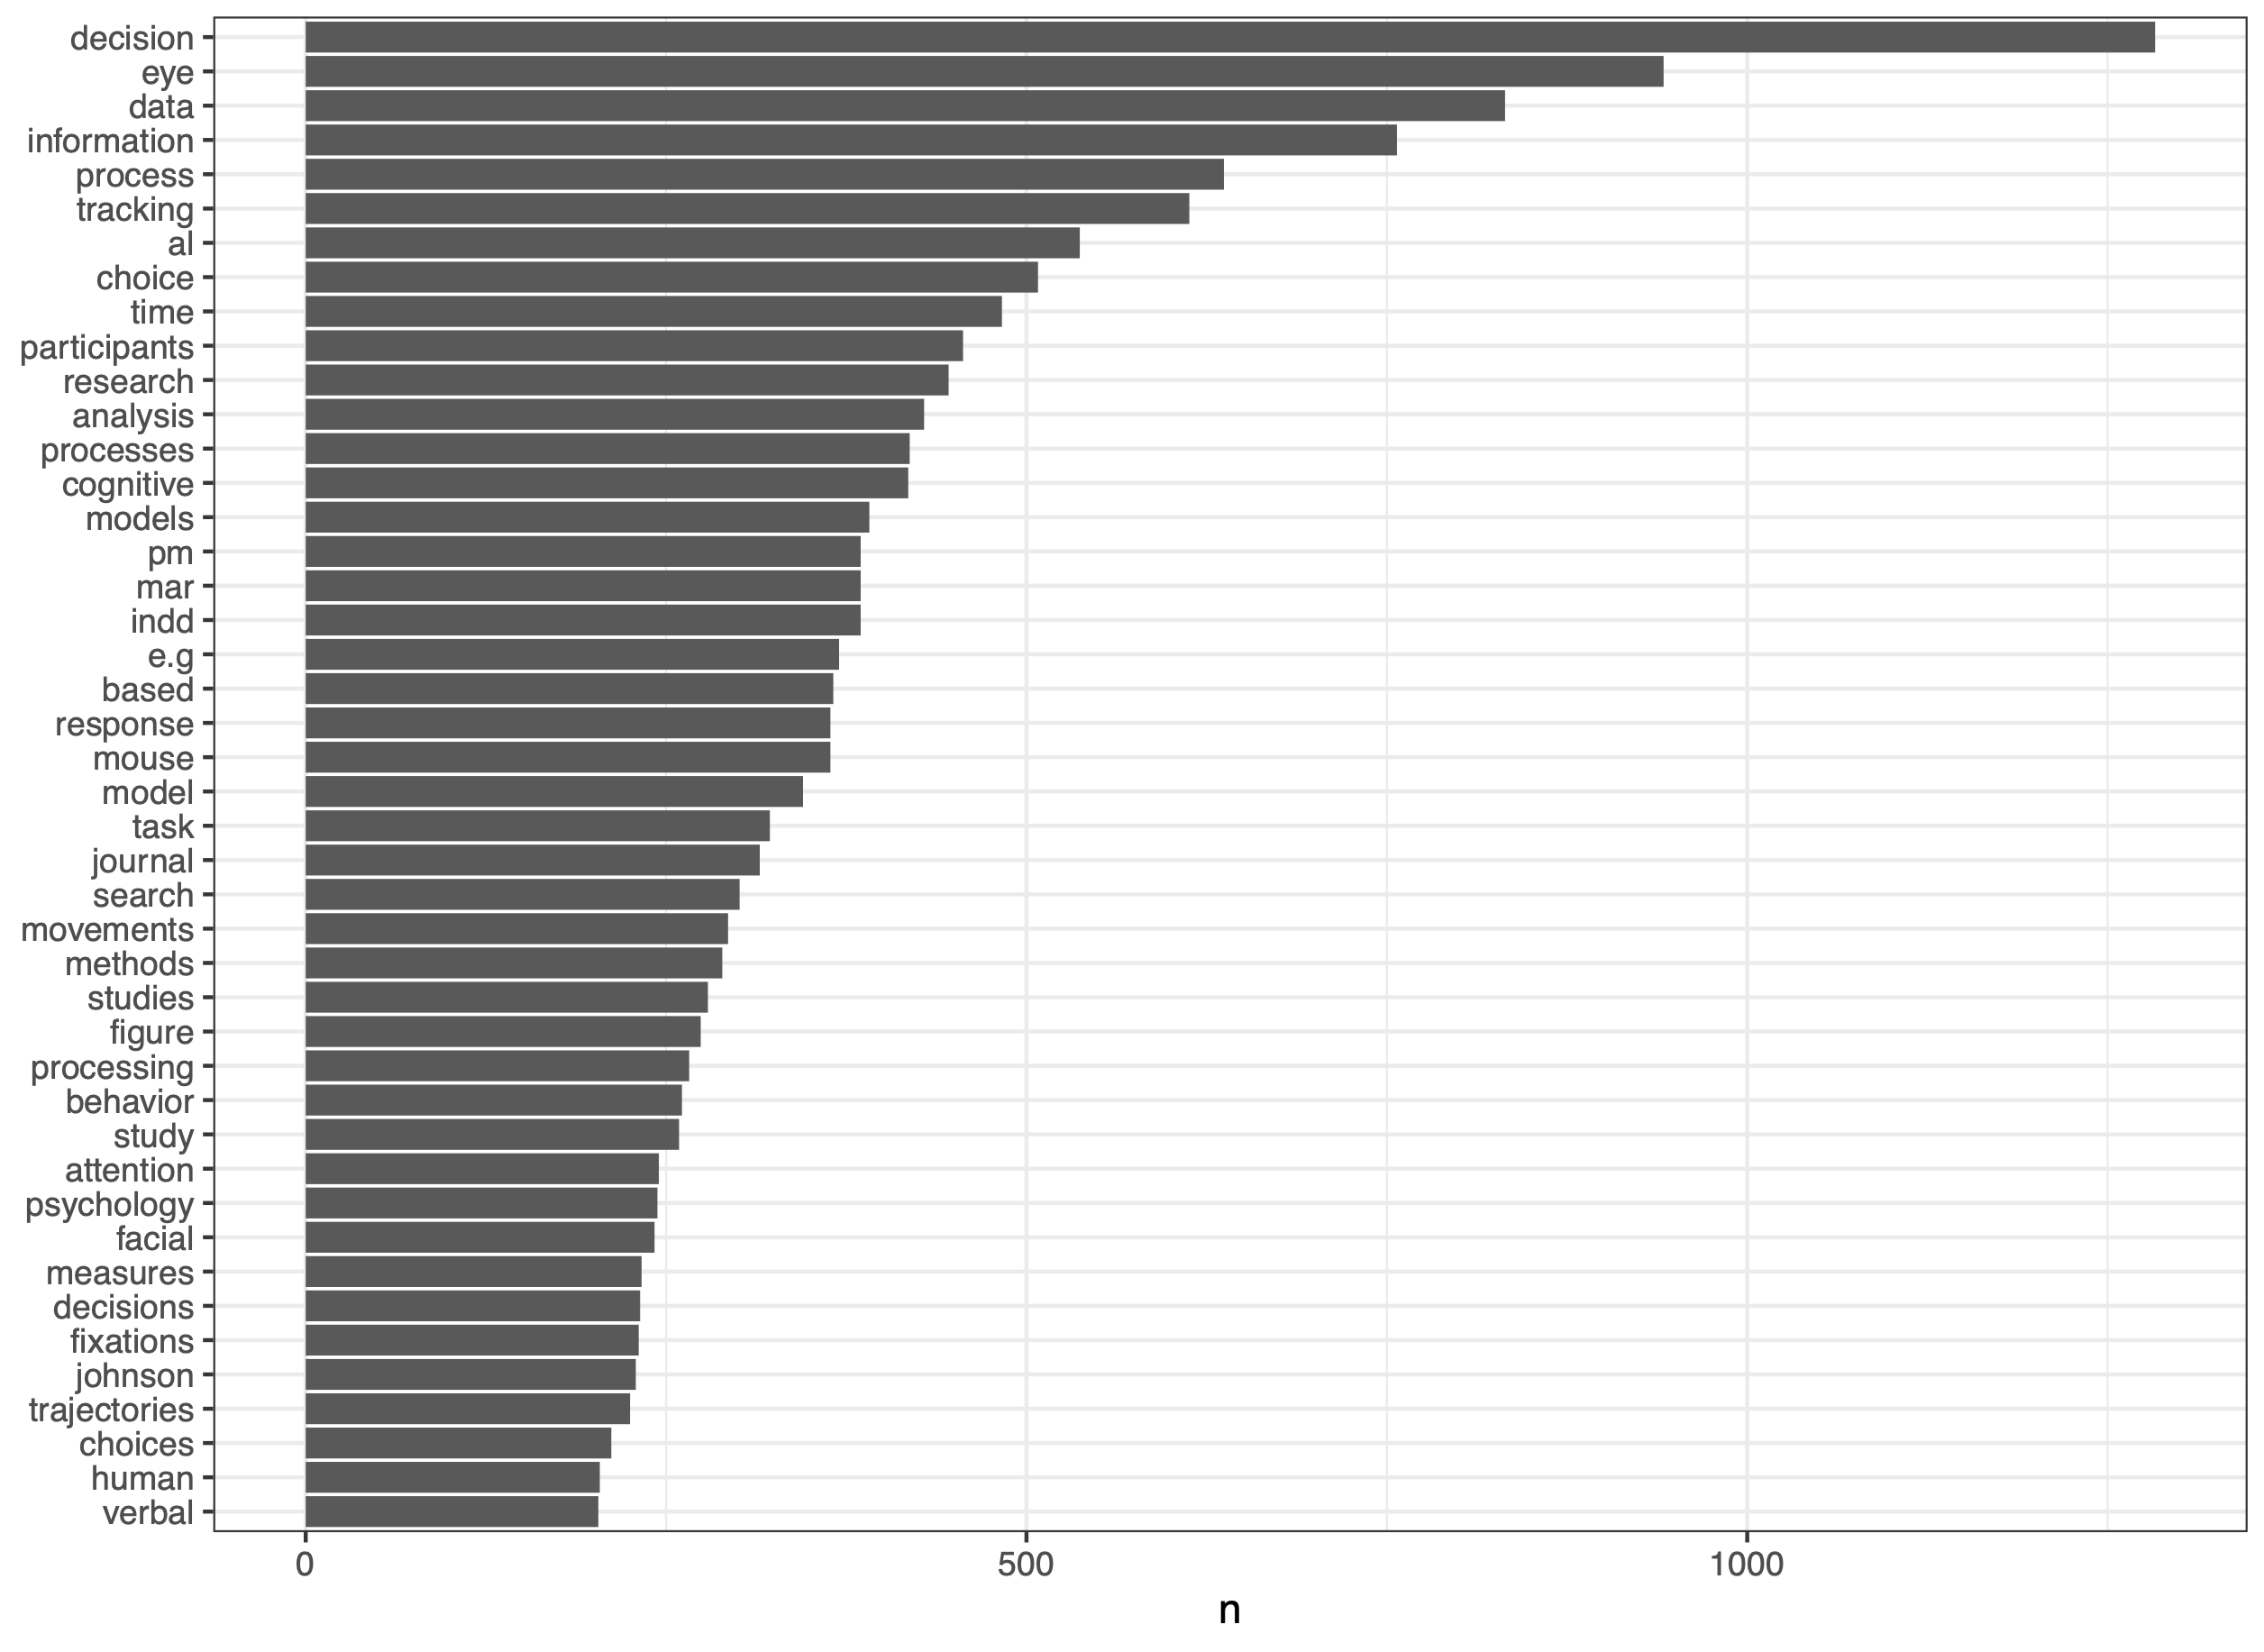
No big surprises there for a process tracing book in decision making - but still - models pop up quite high in the list and trajectories - the new kid on the block when it comes to mousetracking also gets a mention - the list is truncated and I did not bother to remove things like ‘et al.’ or ‘e.g’ (the second . got caught by the script, the first one not).
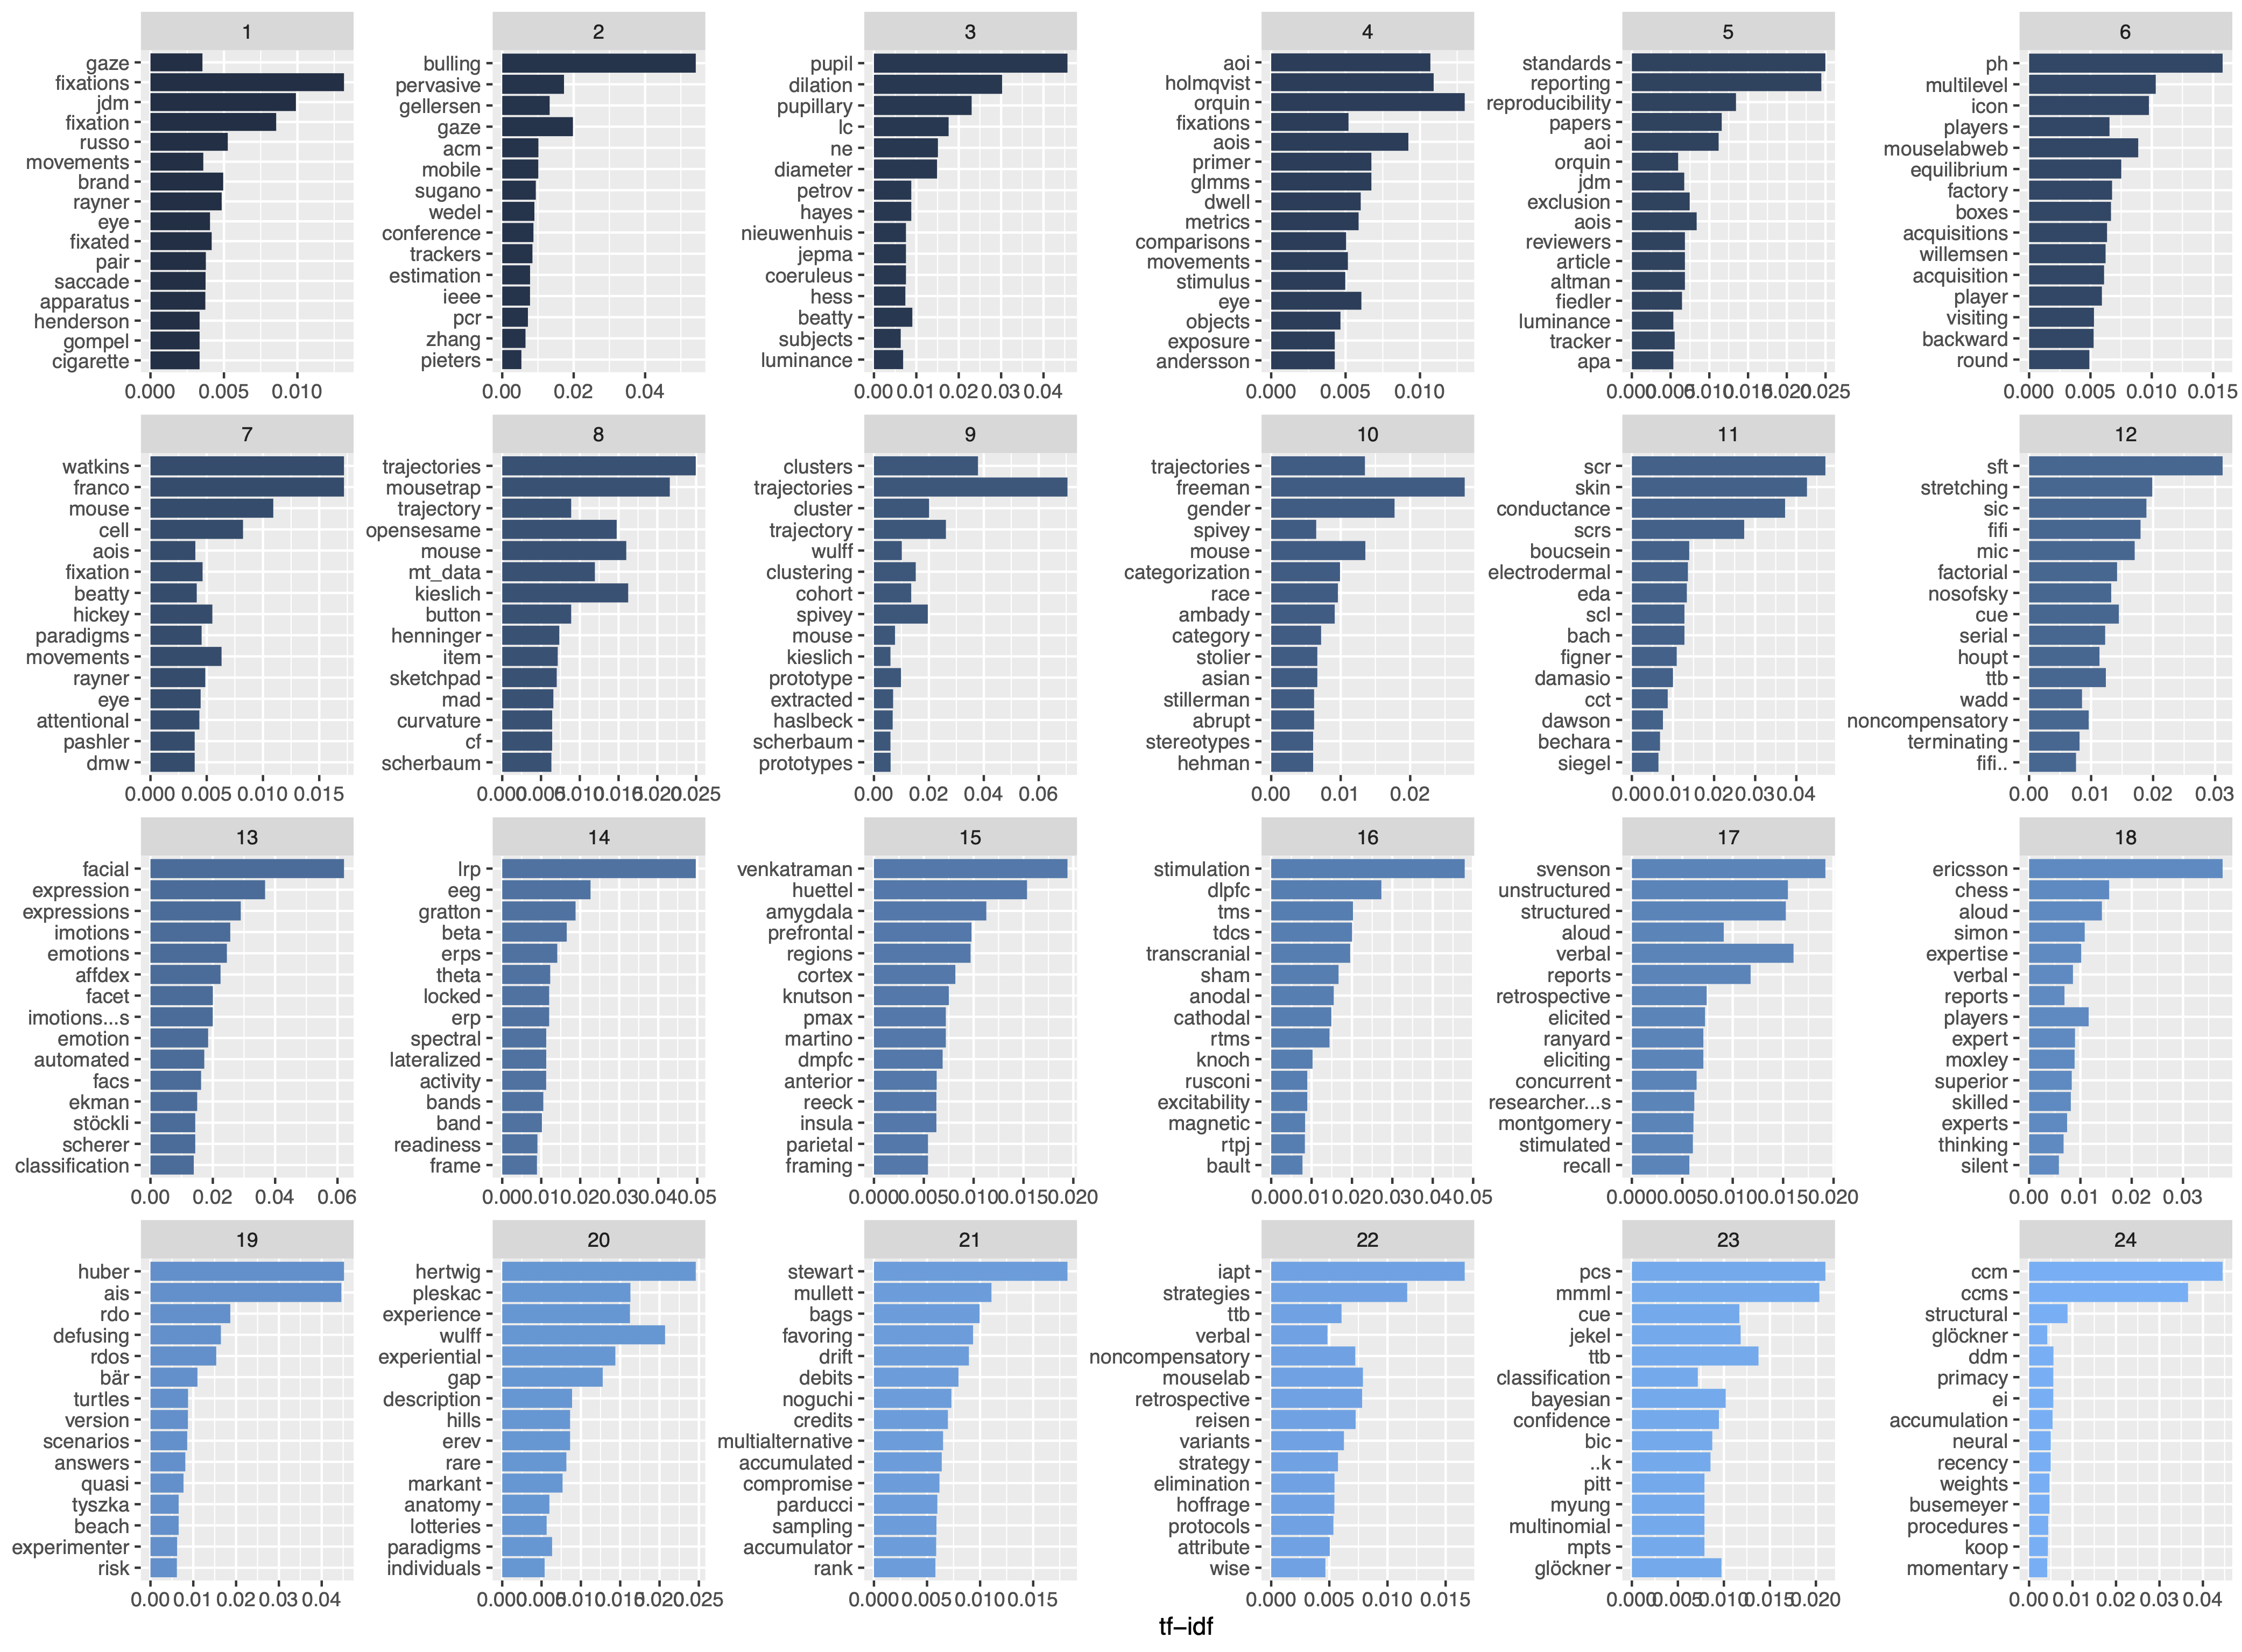
This is more interesting - I calculated the tf-idf (term frequency–inverse document frequency) which tells us how important a word is but takes care of how often a word appears in general - so a better measure than just using the raw frequency of a word. I did this for each chapter (chapter names are listed in the other post). At first I wanted to remove the reference list but I realized that it provides an interesting insight - namely how often authors cite themselves in their chapters. A caveat in this graph is that the x-axis has different scaling. Apart from that it actually describes the content of some of the chapters pretty well - ah and I just saw that I should have added some stemming to avoid ‘clusters’ and ‘cluster’ being listed separatly … but well …
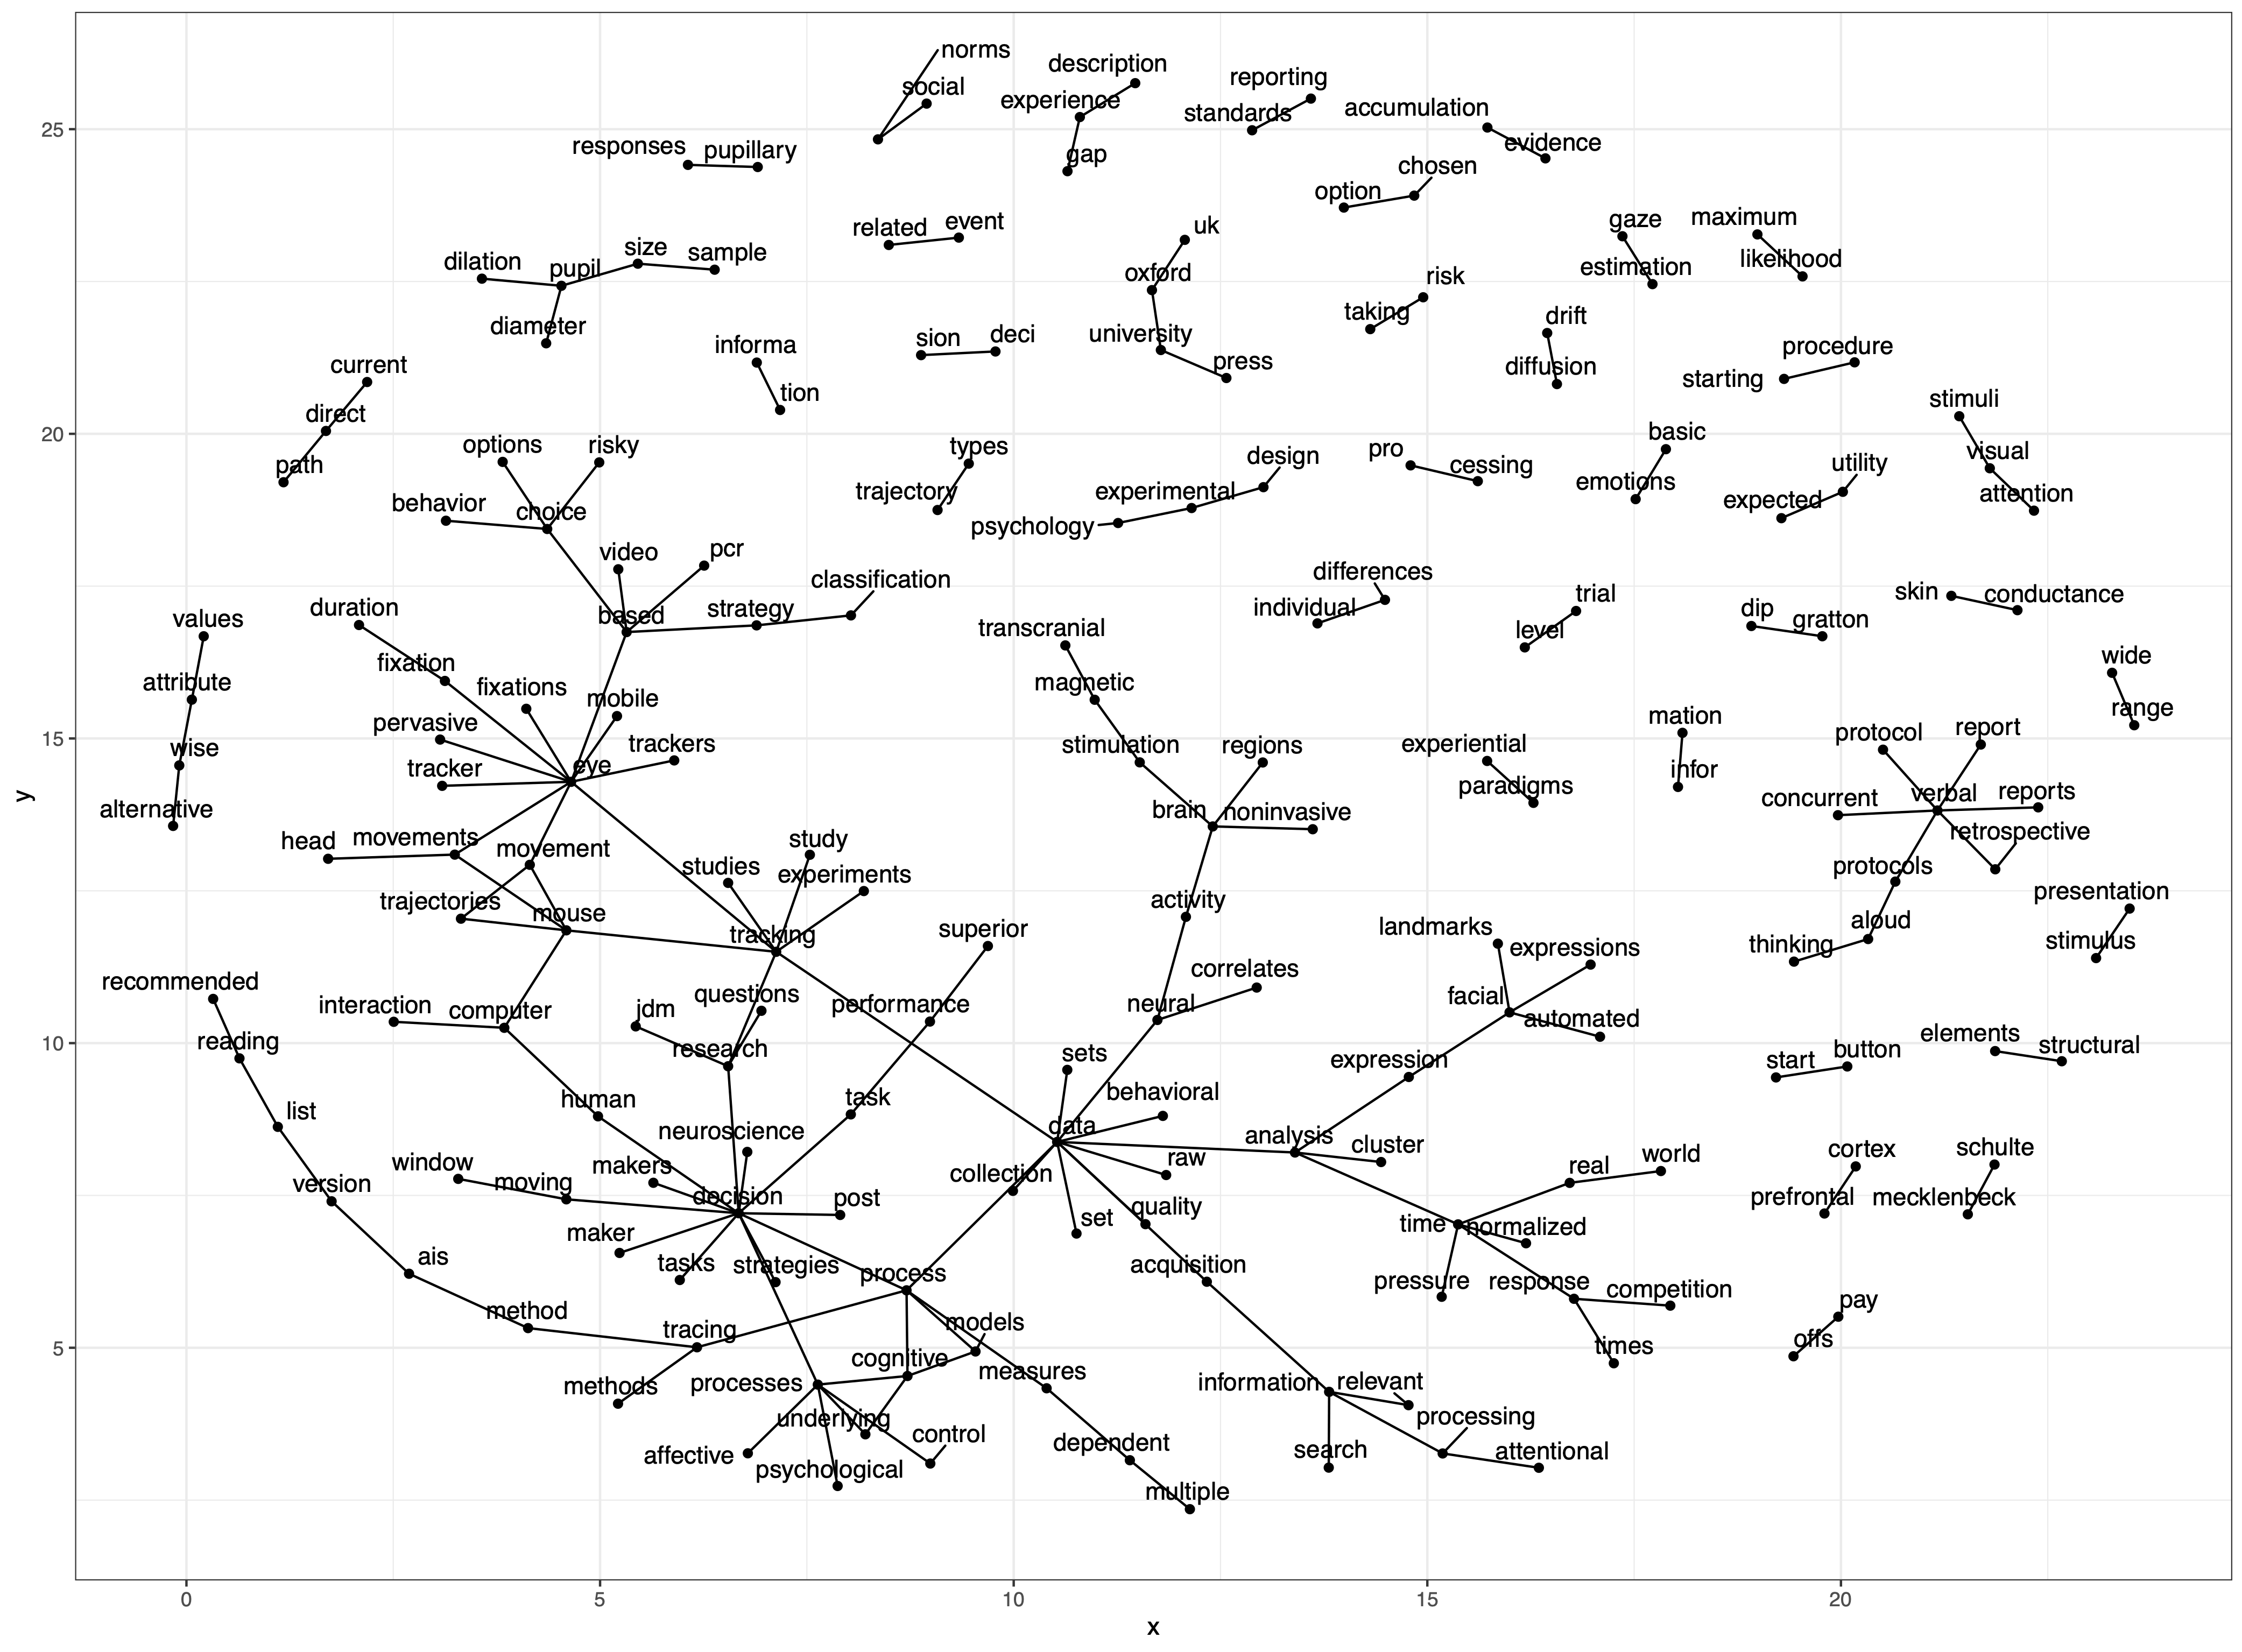
For the kicks - here is a network diagram of bigrams. There is clearly some more work to do here …
Shoutout to the tidytext people - you got a great package there!