


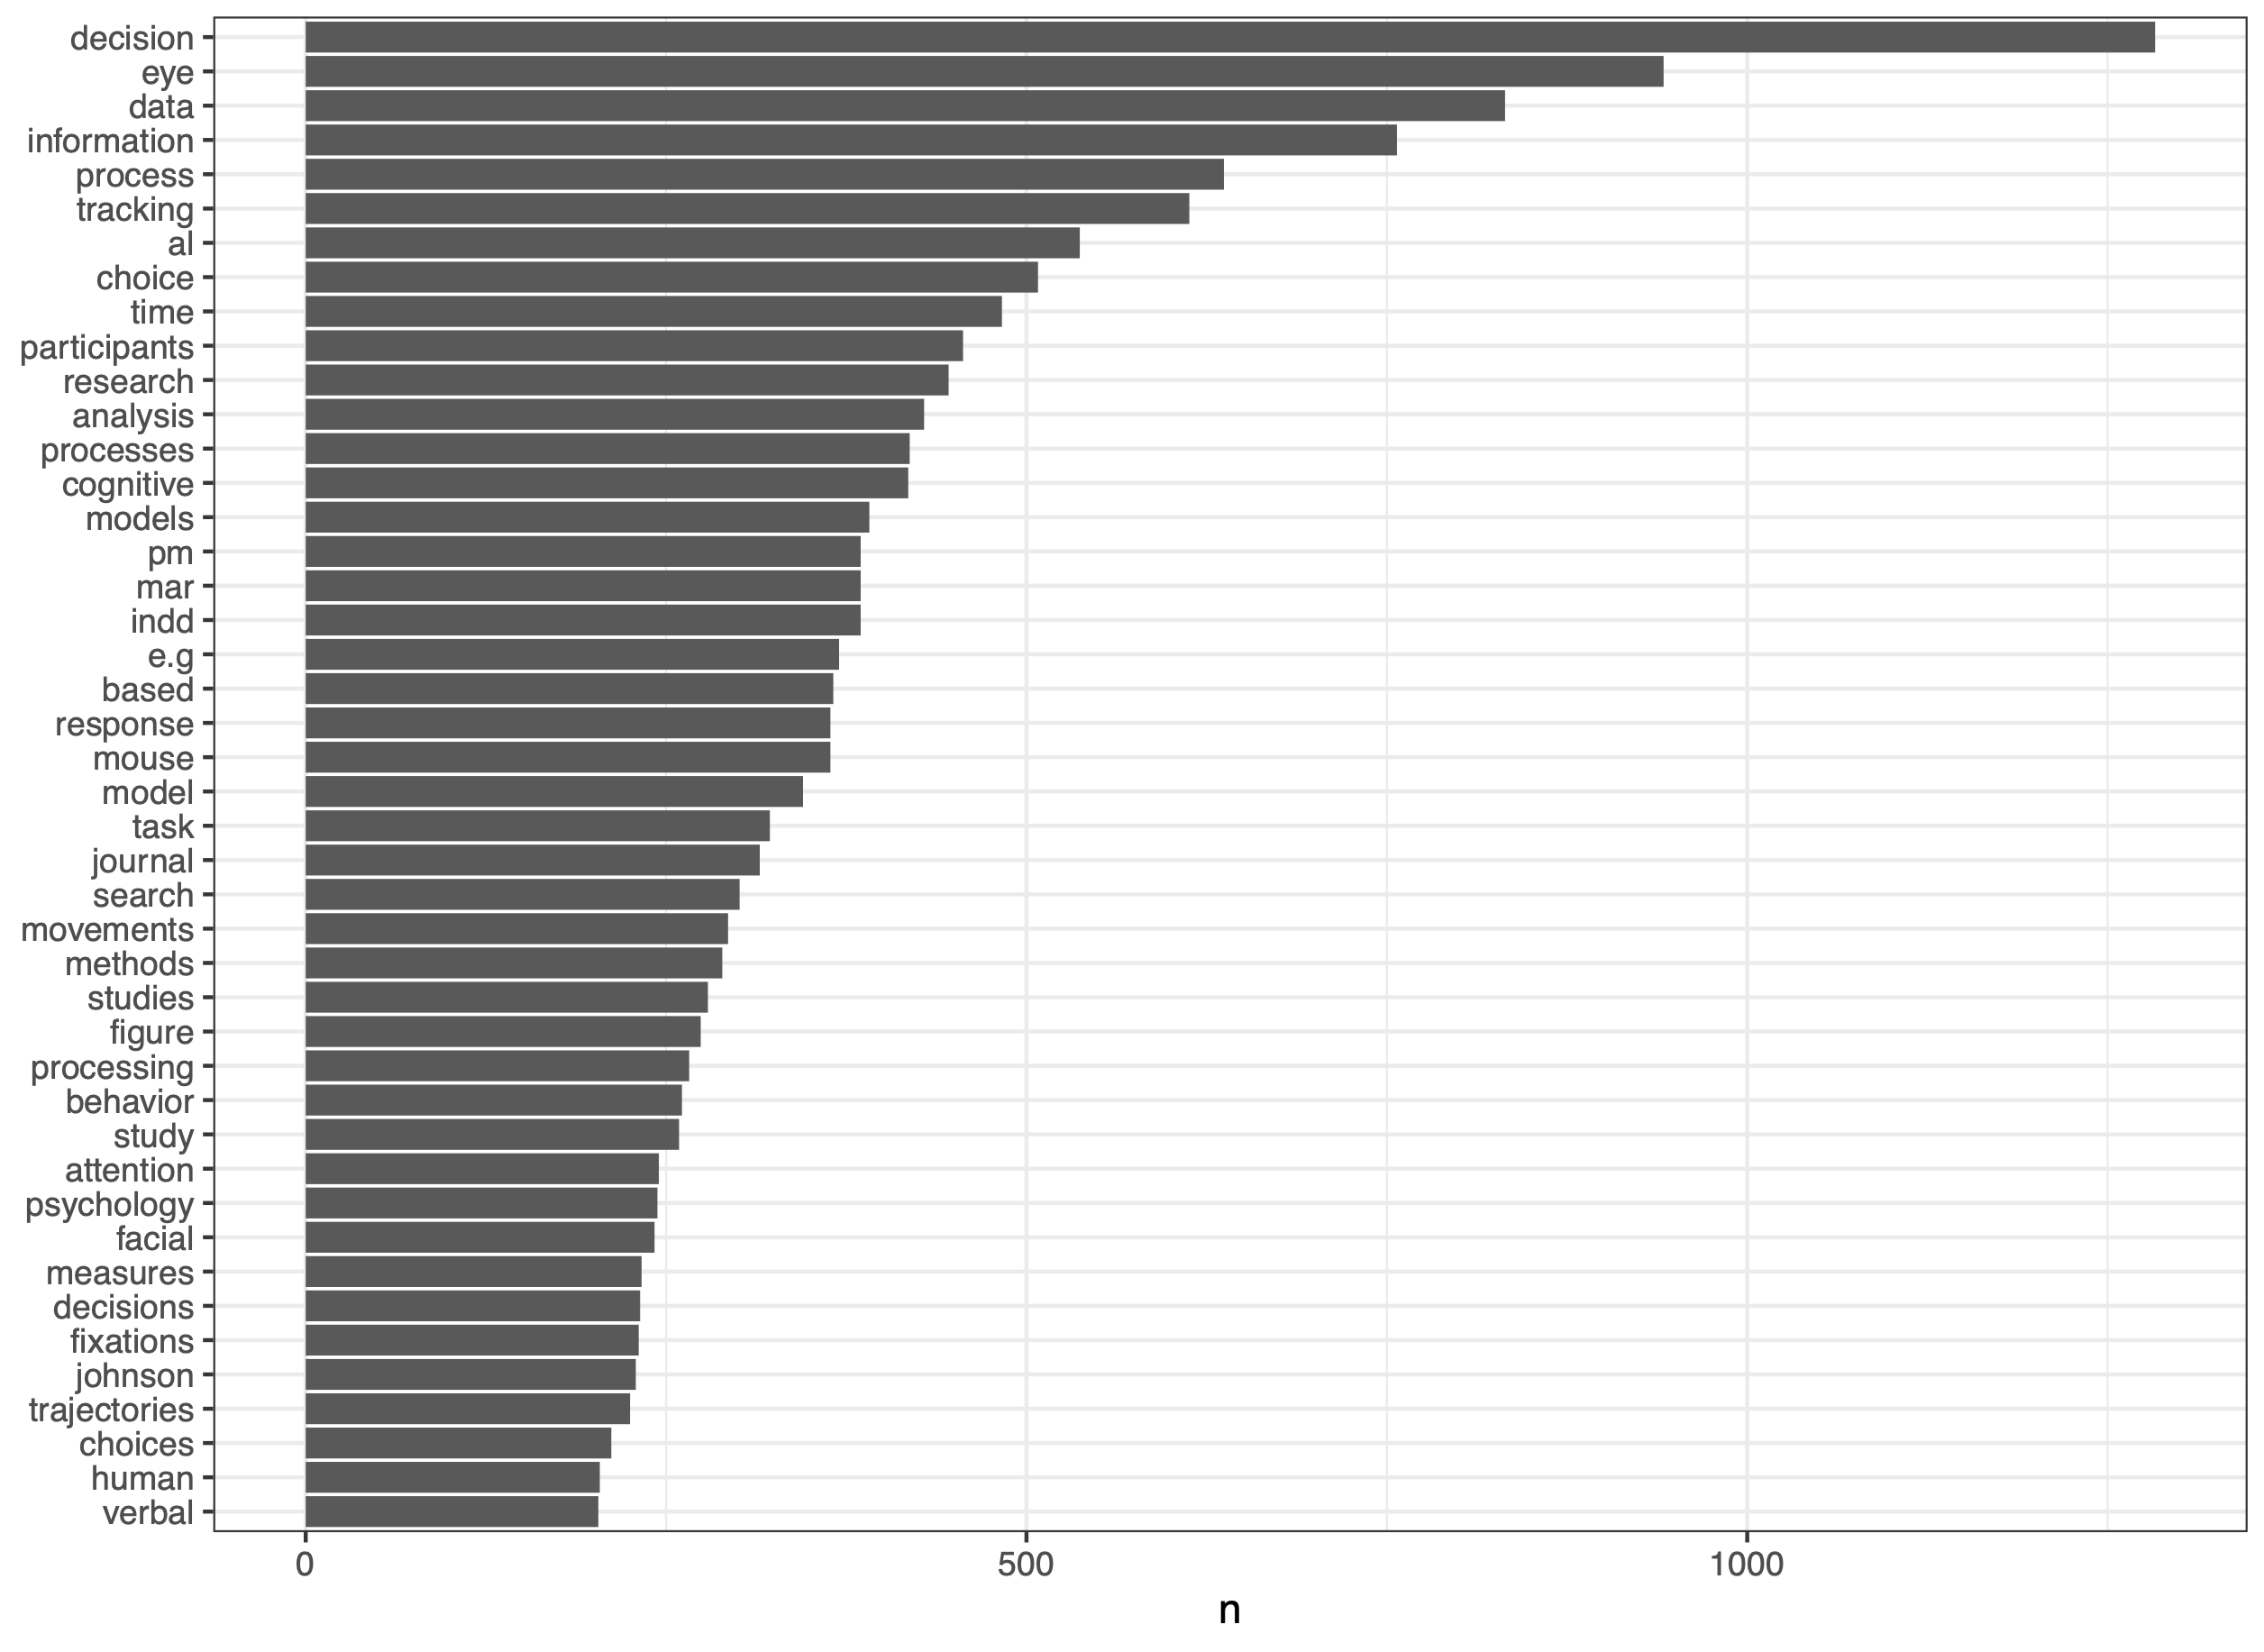
Handbook of Process Tracing Methods
Process Tracing
Decision Making

Growing up to be old
Decision Making
Process Tracing
Eye-Tracking with N > 1
Process Tracing
Methods
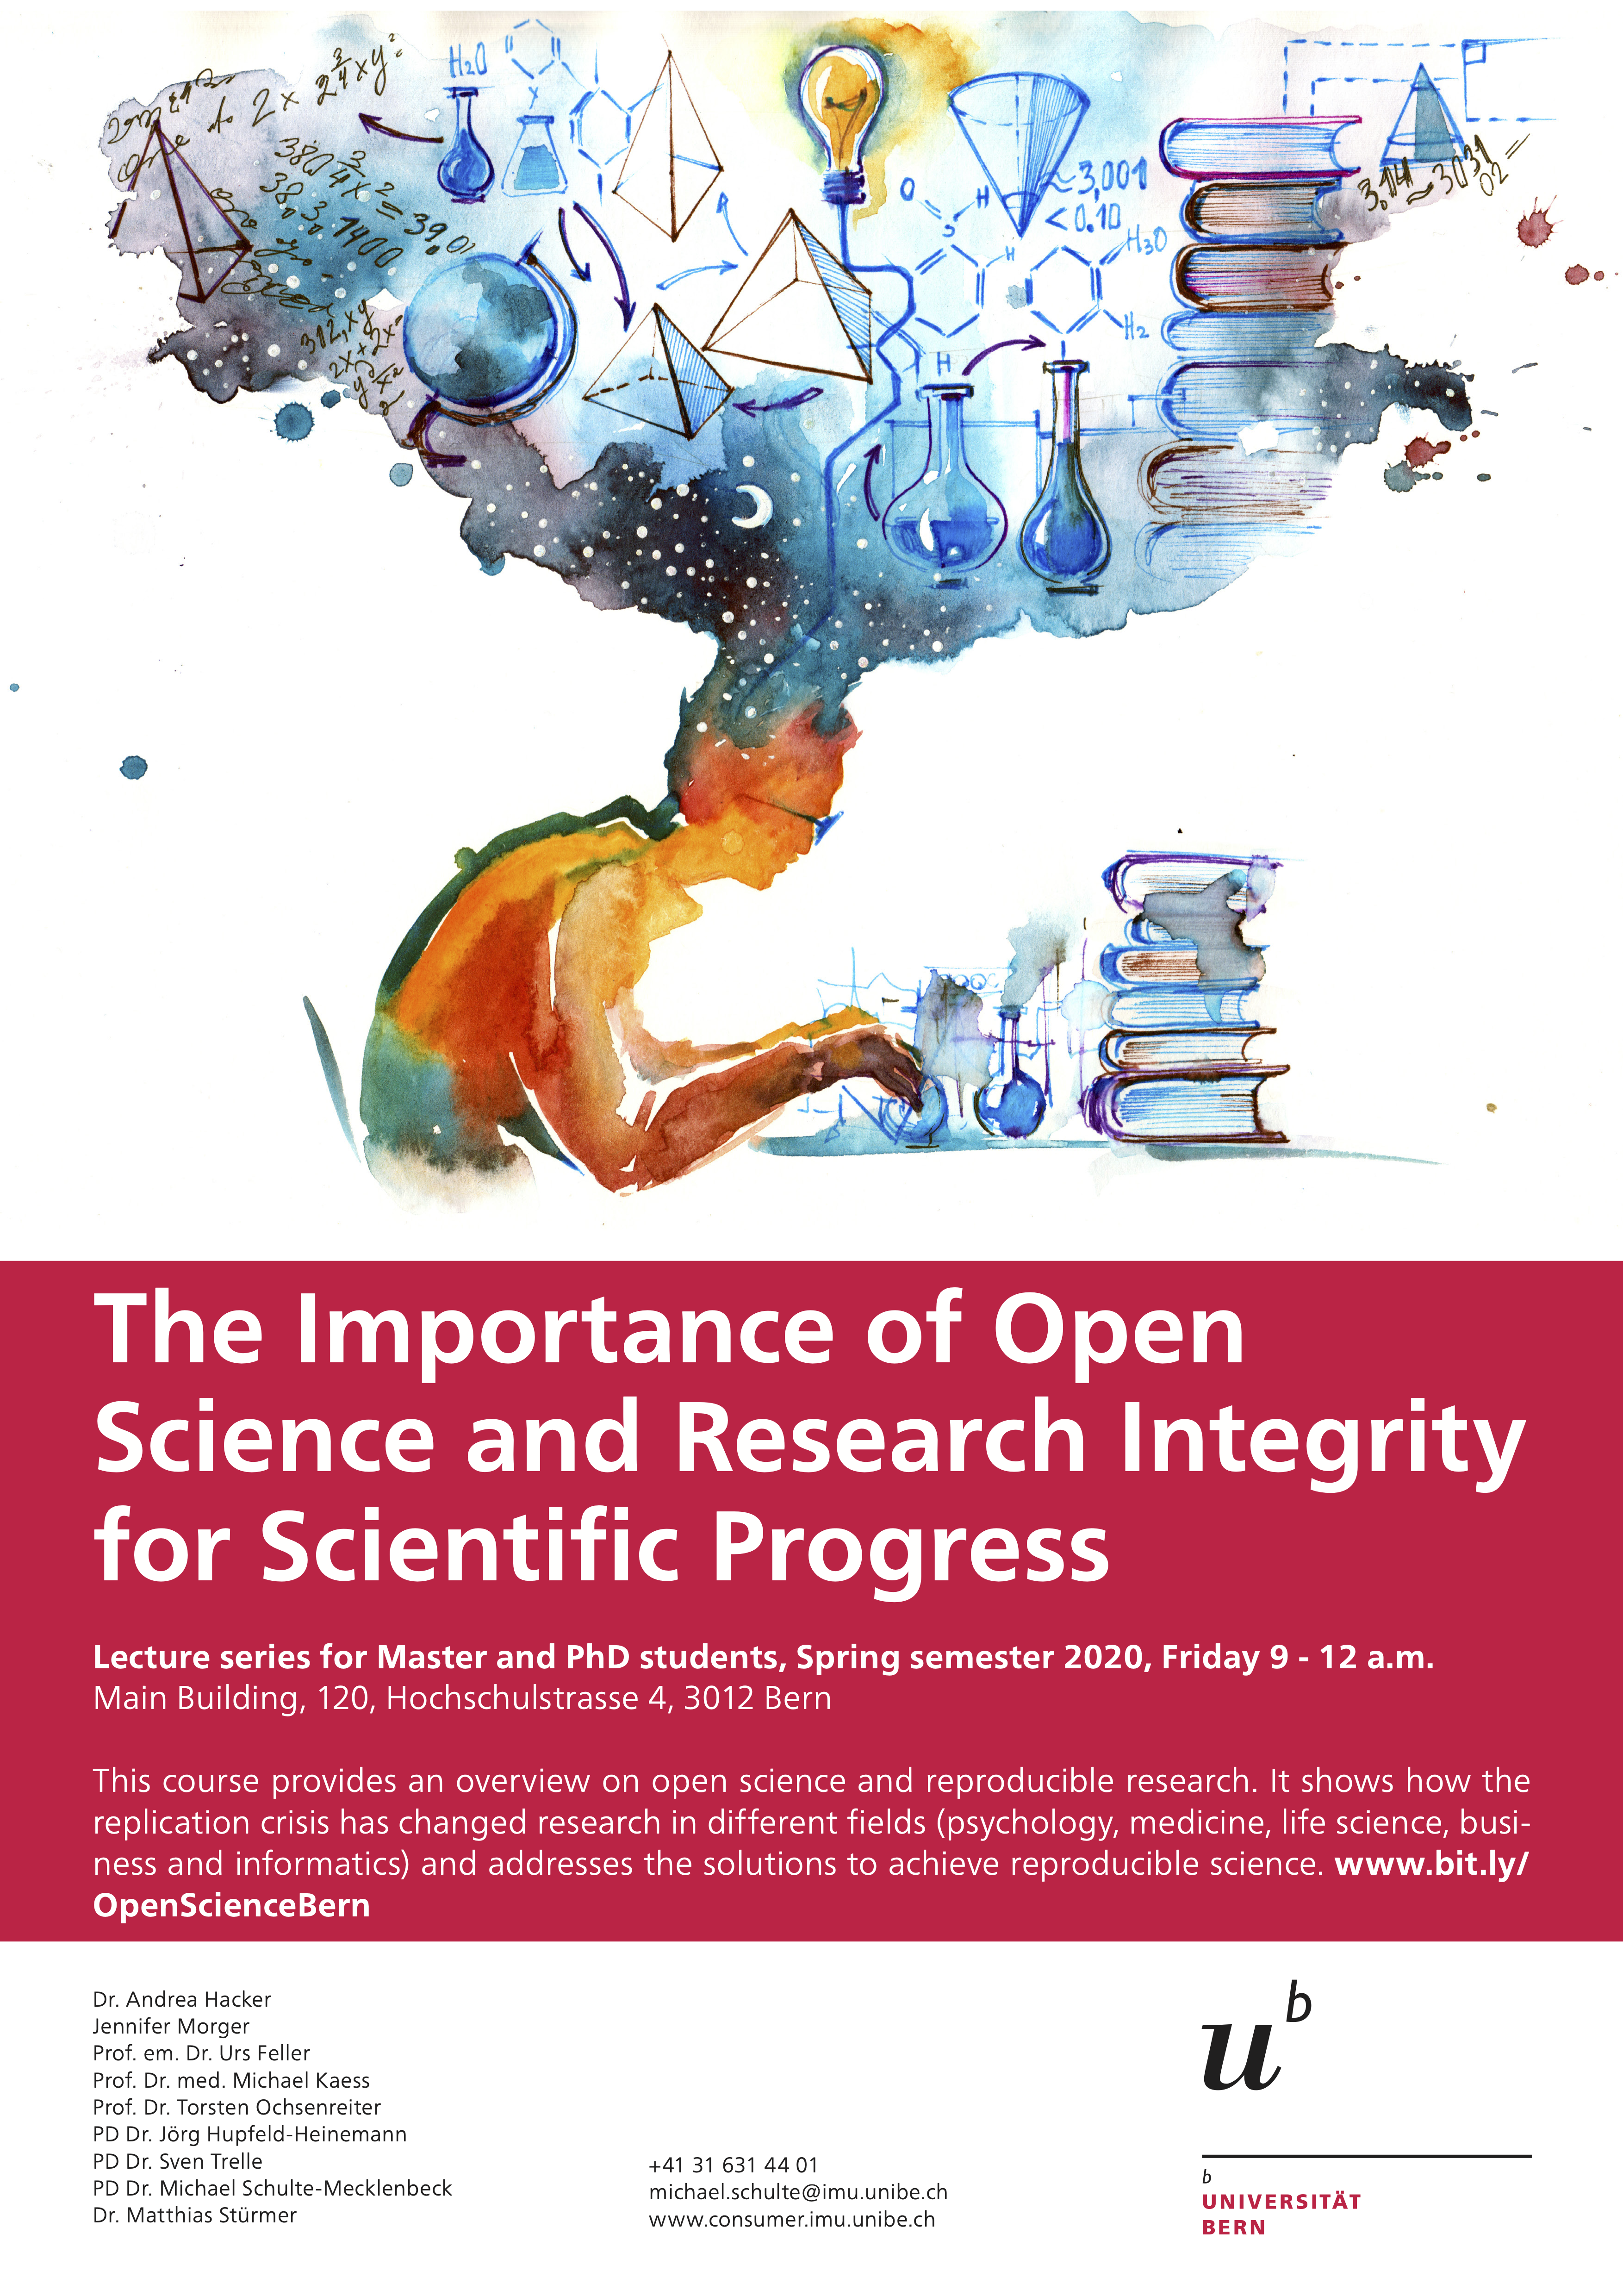
Open Science
R
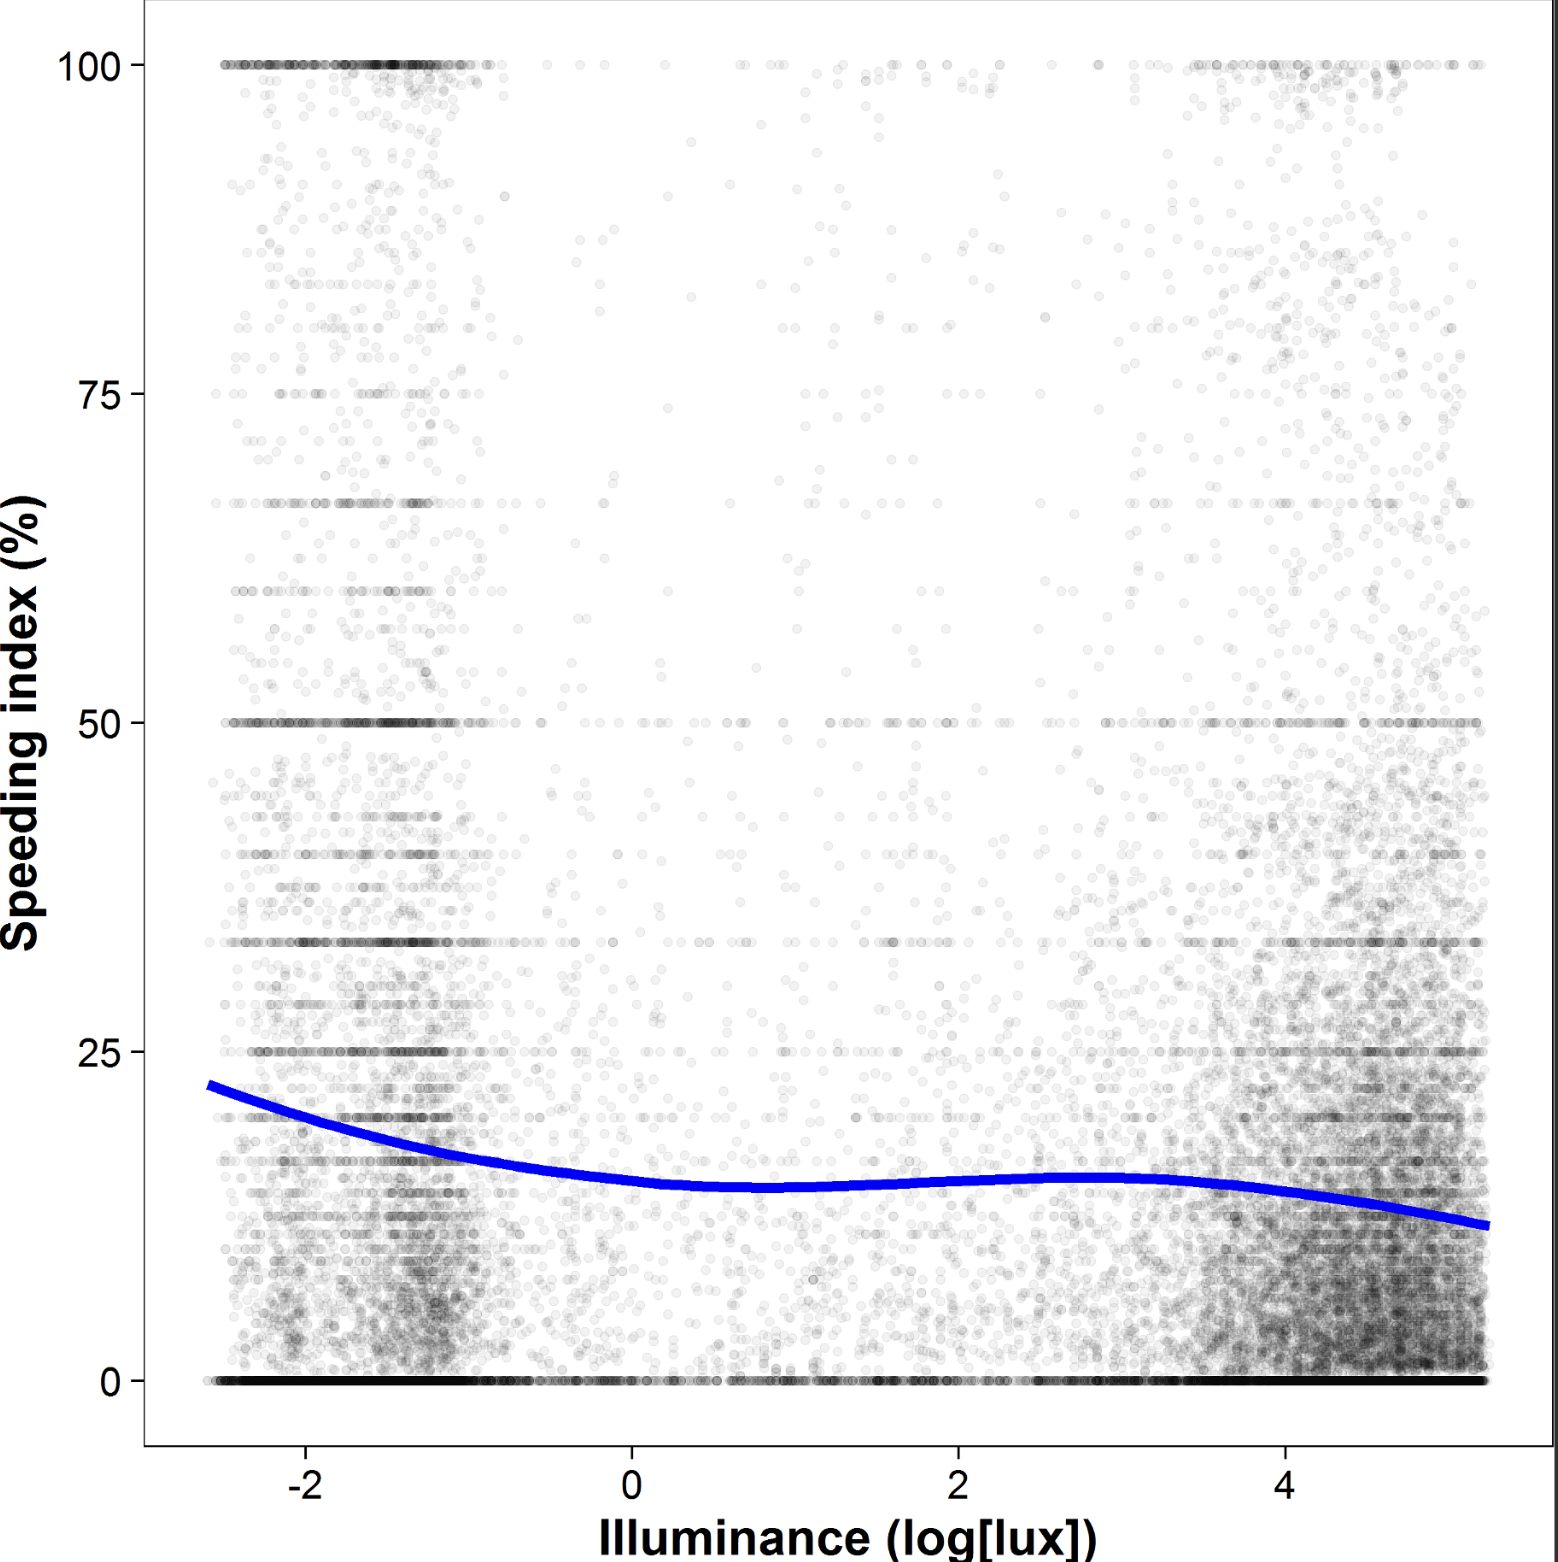
Statistics
Everything is fucked …
Decision Making
Replication
Science
Teaching
Moving an idea into business
Decision Making
Process Tracing
Open Science
No matching items